
All campaigns in the left menu opens the campaign list: every campaign of the account, its
status, and its numbers for the reporting range. This page is how to read it and how to find a campaign in it. To start a
new one, see New campaign.
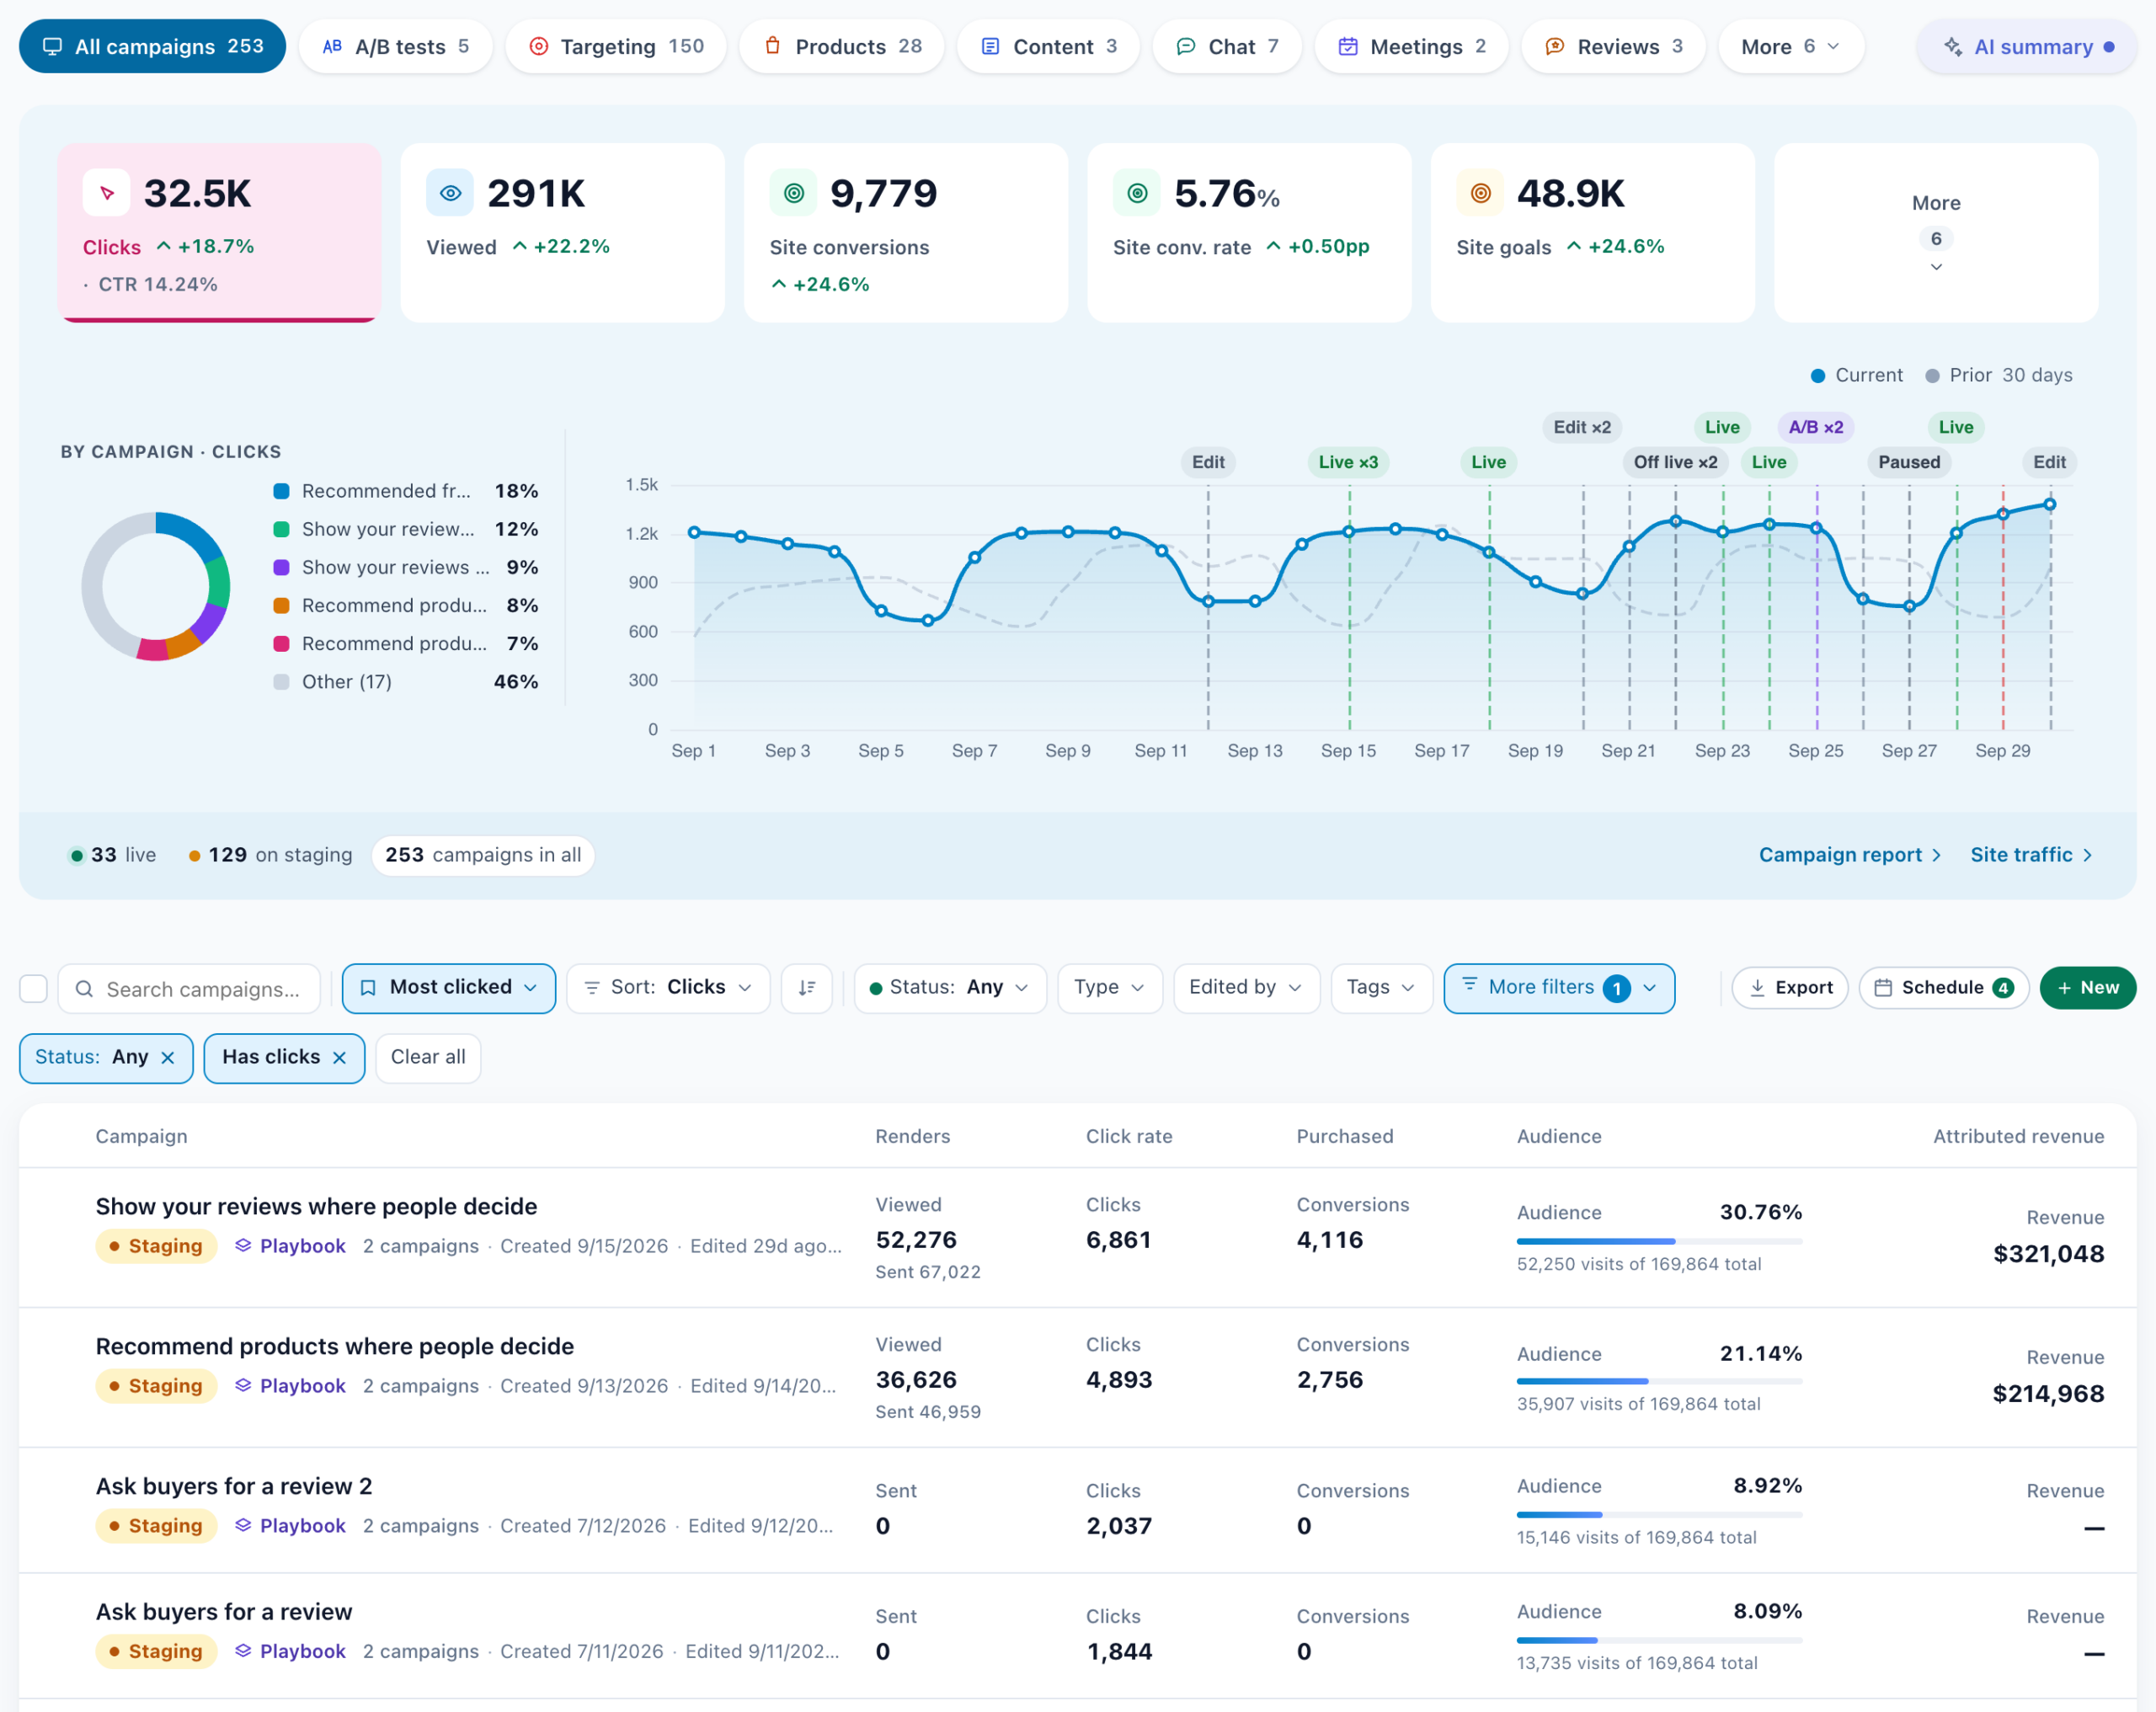
The top: type pills and the summary
- Type pills. All campaigns comes first, then one pill per kind of campaign you run,
such as Targeting, Products, Emails or A/B tests. Each pill has its icon, its colour
and its count. Types that do not fit on the row, and types with no campaign, are under More. A pill
narrows the whole page to that type, its numbers included. Press it again to go back. - ✦ AI summary, at the end of the row, shows the period in words — see below.
- The summary, on a pale blue panel: tiles with the main numbers of the type for the reporting range,
and a chart. Click a tile to chart that number. On the band at its foot, live, on staging and
campaigns in all are counts you can click to show only those campaigns. Beside them are links to the reports for
that type, such as Campaign report or Site traffic. What the metric tabs, the Site figures and the A/B
at-a-glance counts mean: see Performance Metrics › The campaigns list.
What a row says
One row per campaign, under one header. A playbook is one row for all of its campaigns.
- The status, first under the name: Live (green), Staging (amber:
only your staging audience sees it), Draft (grey) or Paused (slate: a campaign that was
live and was taken off). - The type as an icon and its name. Then A/B test on a campaign that really splits its
traffic, ★ Top performer, its tags, and what it carries — for example 2
actions serving live traffic. A warning shows in red, such as Nothing running when every action is
switched off. - Its numbers for the range, chosen by its type. Click the name’s line to expand the row, and
double-click the name to open the campaign.
No numbers yet: the next step
A campaign with nothing in the range says where it stands and what to do next, instead of a row of dashes. The link
opens the editor or the preview. Nothing is published, paused or turned on from here.
| Where it stands | The row says |
|---|---|
| On staging | On staging – only your team sees it · Preview › |
| Live for less than three hours | Live since 14:05 · first numbers usually within 1-3 hours |
| Live, but nobody matched | Live · no visitors matched in this range (an email: nothing sent in this range) · Check targeting › |
| Taken off live | Paused since Oct 9 · Turn back on ›, which opens its QA step |
| No content | No content yet · Add content › |
| Never published | Not published · 2 actions ready · Review and publish › |
The row’s buttons
Hover a row, or reach it with Tab, and its buttons show on the name line: the rules and content steps,
Preview, Duplicate, Publish, Switch to staging or
Switch to draft, then Quick overview and Performance as icons, and the
bin. On a narrower screen some of them move under ⋯, but only when two or more would go there.
Preview is greyed on a draft, which has nothing published to preview — see Testing & QA.
Quick overview expands the row: its numbers, its audience goals and engagement, when it was created
and how long it has been live, its audience rules, and its actions, each with Edit content, a switch to
pause or activate it, and a preview on your site.
Finding a campaign: the bar
The bar over the list is one row: the search, Quick views, Sort,
Status, Type, Edited by, Tags, More
filters, Export and Schedule. Every filter that is on shows as a chip under the
bar. Remove one with its ×, or press Clear all. Each choice in a menu shows how many campaigns it
would leave.
Quick views
A view sets every filter and the sort at once. The menu has three groups:
| Group | Views |
|---|---|
| Quick | Recently opened by me (the campaigns you opened lately in this browser, up to eight), Most clicked, Recently modified, Recently created, Edited by me, Created by me |
| Ready-made | Needs attention (live, but nothing showed in the range, or every action is switched off), Unpublished changes (live campaigns edited after the version that is live), Top performers, A/B tests running, A/B tests close to a winner (a leading version with at least a 95% chance of being best), A/B tests decided this period, Edited in the last 7 days, Went live this week, Taken off live this week, Not touched in 90 days |
| Saved for this account | Your own. Set the filters and the sort, then Save this view… and name it. Everyone on the account sees it. The bin beside a saved view deletes it for everyone; the campaigns are not touched. |
The view is in the page’s address, so a link to the list opens on the same view.
Sort
- Campaign: Last modified (the default; an edit to one of its actions counts),
Created, Recently opened, Name (A→Z), Status
(live first), Type, Actions. - Performance: Revenue impact, Conversions, Conv.
rate, Purchases, Clicks, CTR, Viewed,
Sent, Audience. - A/B tests: Closest to a winner.
Status, Type, Edited by and Tags
- Status: Live or recent (the default: live and staging campaigns, and drafts from the
last 30 days), Live, Staging, Drafts, Any. - Type: a panel of tiles, one for each campaign type you have, each with its icon, its colour and its
count, under the same headings as the type pills. A type the other filters leave empty is dimmed. - Edited by: Me, then everyone who last edited a campaign, and
Unassigned. - Tags: one or more of your tags.
More filters
| Group | Filters |
|---|---|
| Activity in the period | Has traffic, Never viewed, Has clicks, Converting, Has revenue, Under-performing (CTR < 1%) |
| Setup | Needs attention, Unpublished changes, Only with actions, Some actions switched off |
| A/B tests | A/B tests (any), A/B tests running, A/B tests decided this period, A/B tests close to a winner. Only campaigns that really split their traffic count as tests. |
| Mine | Created by me, Recently opened by me |
| Dates | Created in the last, Edited in the last, Went live in the last and Taken off live in the last (7, 30 or 90 days), and Not touched in 90 days. The two live dates come from the campaign history, and the menu says when it began. |
Several at once
Tick the box at the start of each row (or Select all). A bar then offers Pause (they
stop serving, on staging and live alike), Resume (published live), Duplicate (each into a
new draft), Export (their numbers for the date range) and Delete. Each asks first.
Export on the bar exports the whole list as CSV or HTML. Schedule emails the email
campaigns’ statistics on a repeating schedule.
Playbook rows
A playbook’s row carries Playbook, its status (Live, Partly
live, Staging or Draft), how many campaigns it has, and the numbers of all of
them together. Double-click it, or press Open playbook, to open it. Performance opens
it on its Performance view, and Preview previews each step.
- Delete a playbook with its bin. The confirmation names each of its campaigns and its status, and
marks the live ones stops showing to visitors. Delete 3 campaigns removes them all. It cannot be
undone. - Its checkbox selects all its campaigns for the bulk actions above.
- Take out of the playbook, under Quick overview › Its
campaigns › Advanced, makes one of its campaigns a campaign of its own in this list. The
campaign stays exactly as it is.
✦ AI summary
The ✦ AI summary pill shows the reporting period in words, written by AI from your
numbers, in the place of the tiles and the chart. Home has the same summary as a card, which opens it
here.
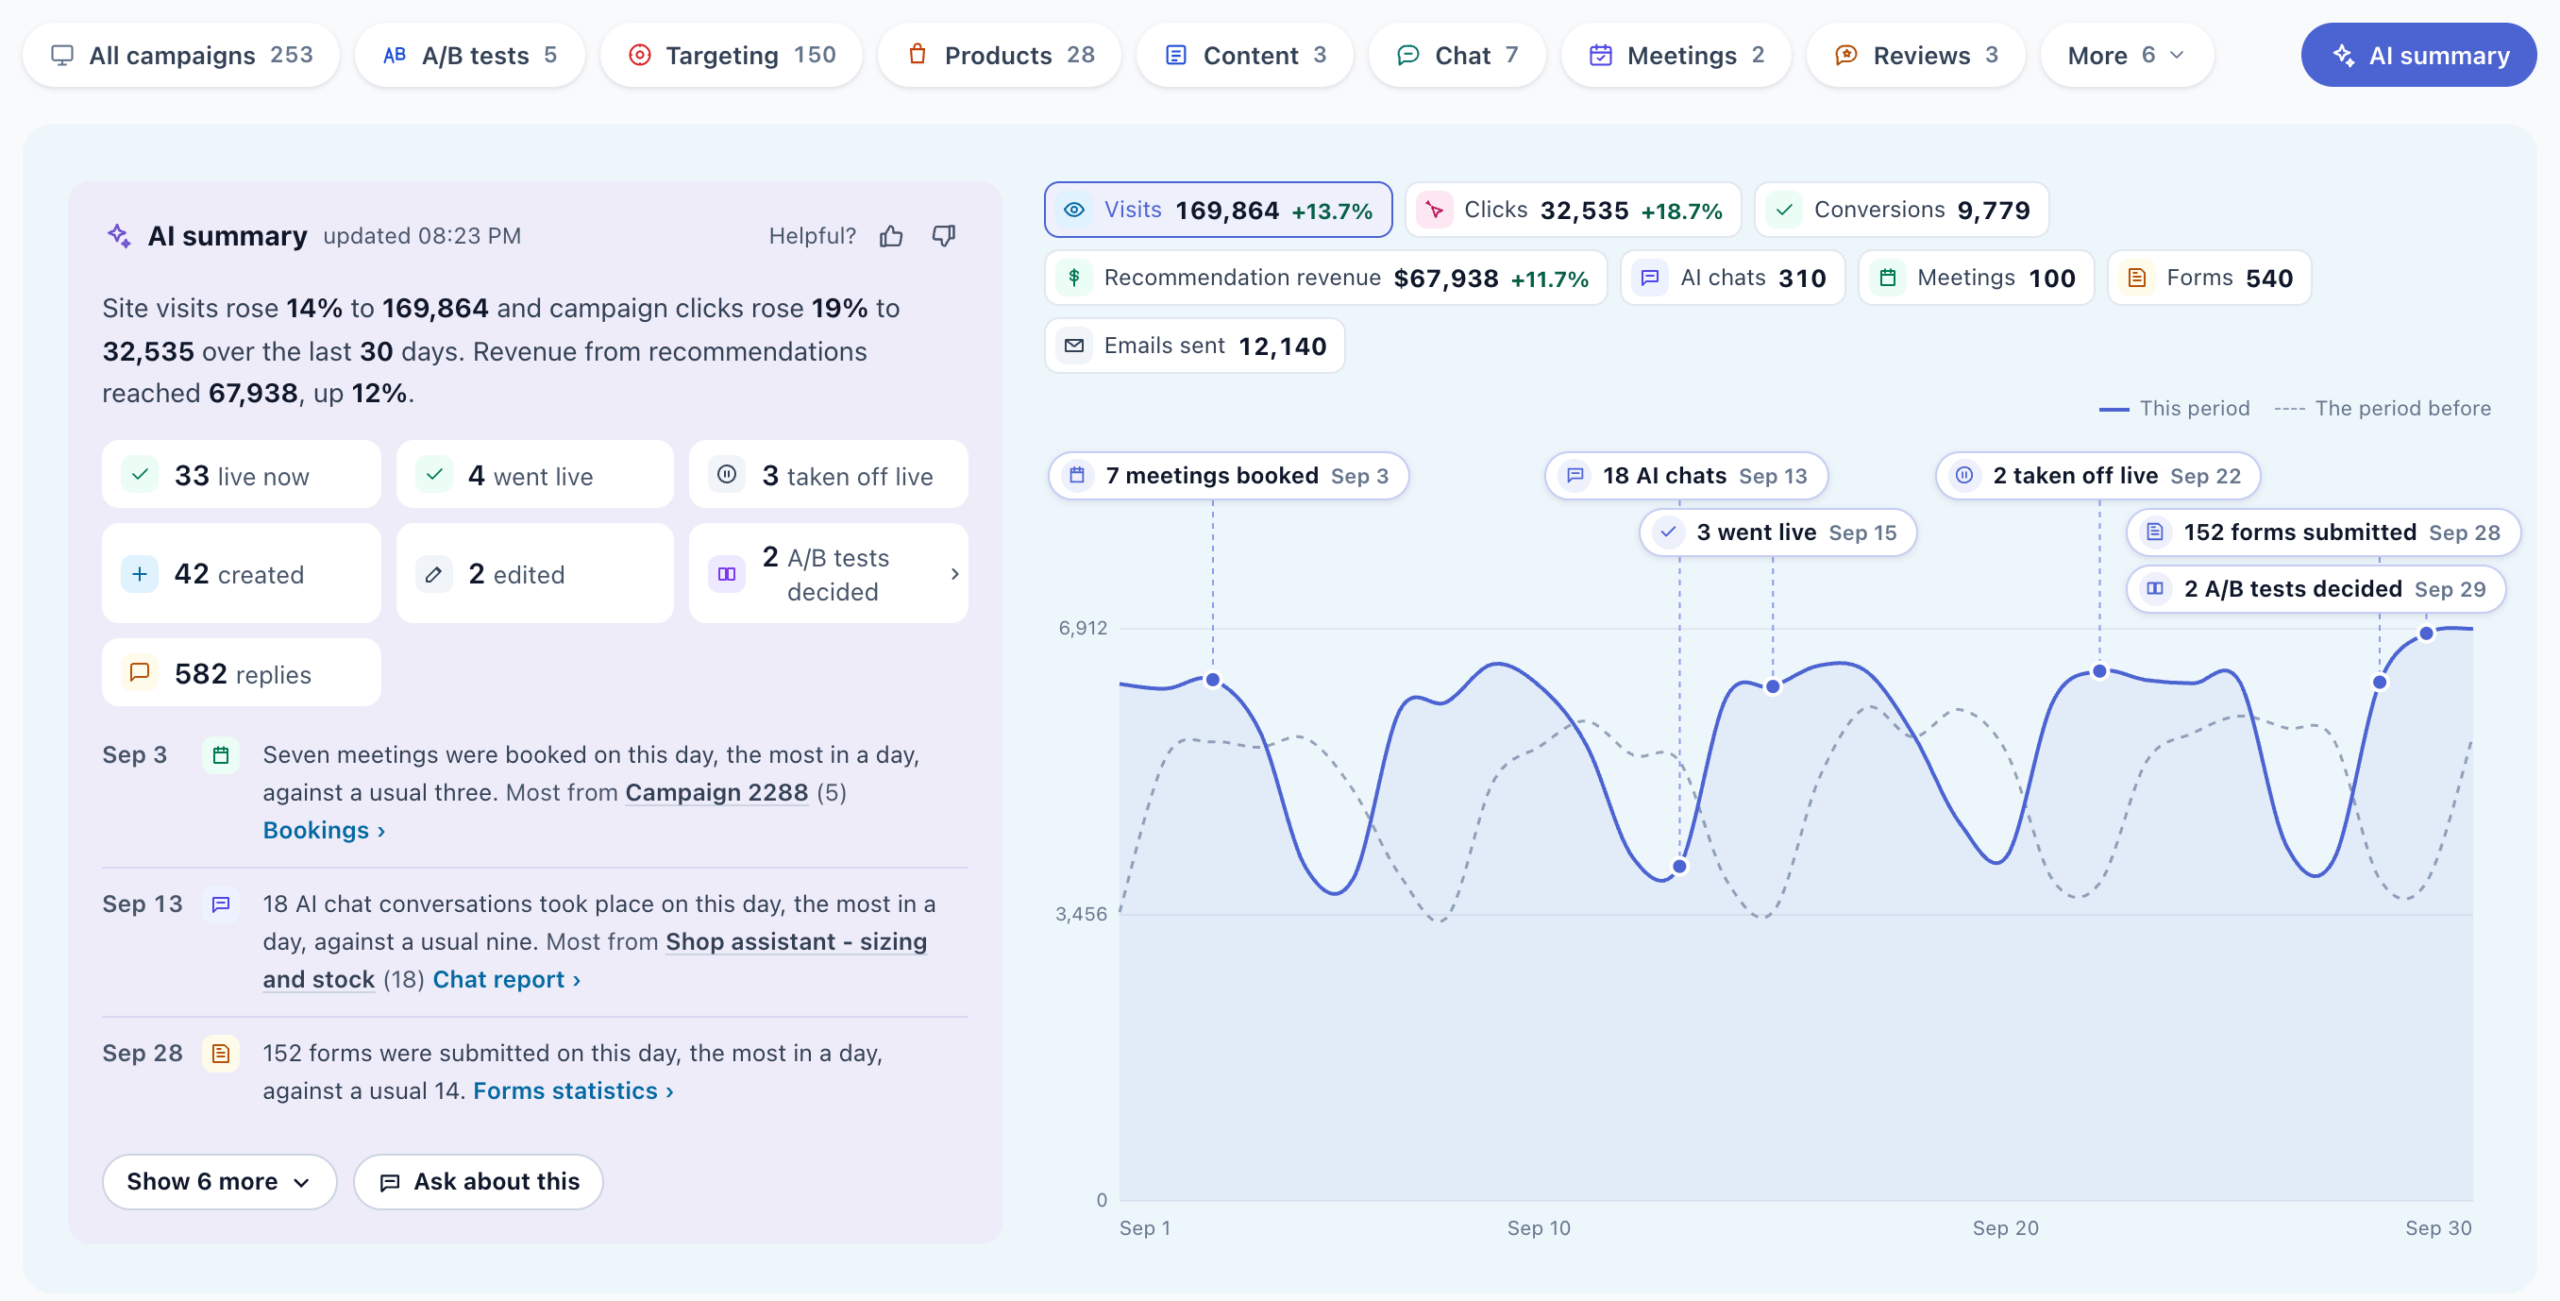
- One sentence about the period, with its figures in bold. Above it: when it was updated, and
Helpful / Not helpful. It is refreshed every two hours. - Facts as tiles: visits, clicks, revenue from recommendations, campaigns live now, how many went live,
were taken off live, were created and were edited, A/B tests decided or close to a winner, survey replies, forms, AI
chats, meetings booked, emails sent. Only the ones your account has. A tile such as 3 went live lists those
campaigns when clicked. - The days that stood out, by date, each with a link to its report: Site traffic,
Campaign report, Chat report, Bookings, Email report and others. A note can name the
campaign that brought the most. - The chart, with a choice of line (Visits, Clicks, Conversions and the
others your account has), this period against the one before, and the same days marked on it. - Ask about this opens the assistant with the period and its notes, asking what drove those days and
what to do next.
Went live, taken off live and edited are counted from the day the campaign history
began.
Related
- New campaign — starting a campaign or an idea
- Campaign history — when each campaign went live, and who changed it
- Playbooks — what a playbook row holds
- Performance Metrics — every number on this screen
- Tags — labels that make a long list readable
- Campaigns