
Every Surveys campaign — and any campaign with a Survey action — has a Surveys tab on its Performance step. It shows who answered, how far they got, where they answered it, and what they said, question by question. An answer is also kept on the visitor’s profile when its question’s Save answer to names an attribute.
Along the top
- Survey — which survey to read, when the campaign has more than one (two A/B versions, say).
- Include possibly automated (n) — off by default; shown when some answers in the period look automated. See below.
- Download answers (CSV) — every visitor who sent the survey in the period, one row each with their latest answers and one column per question, written answers included.
The period is the Performance step’s own date range. The report counts the newest 5,000 answers of the period; with more, it says so — choose a shorter range to count them all.
Every survey of the account side by side — shown, started, finished — is under Reviews & Surveys → Surveys, also under Analytics → On-site campaigns → Surveys; see The Reviews & Surveys section.
The tiles
| Tile | What it counts |
|---|---|
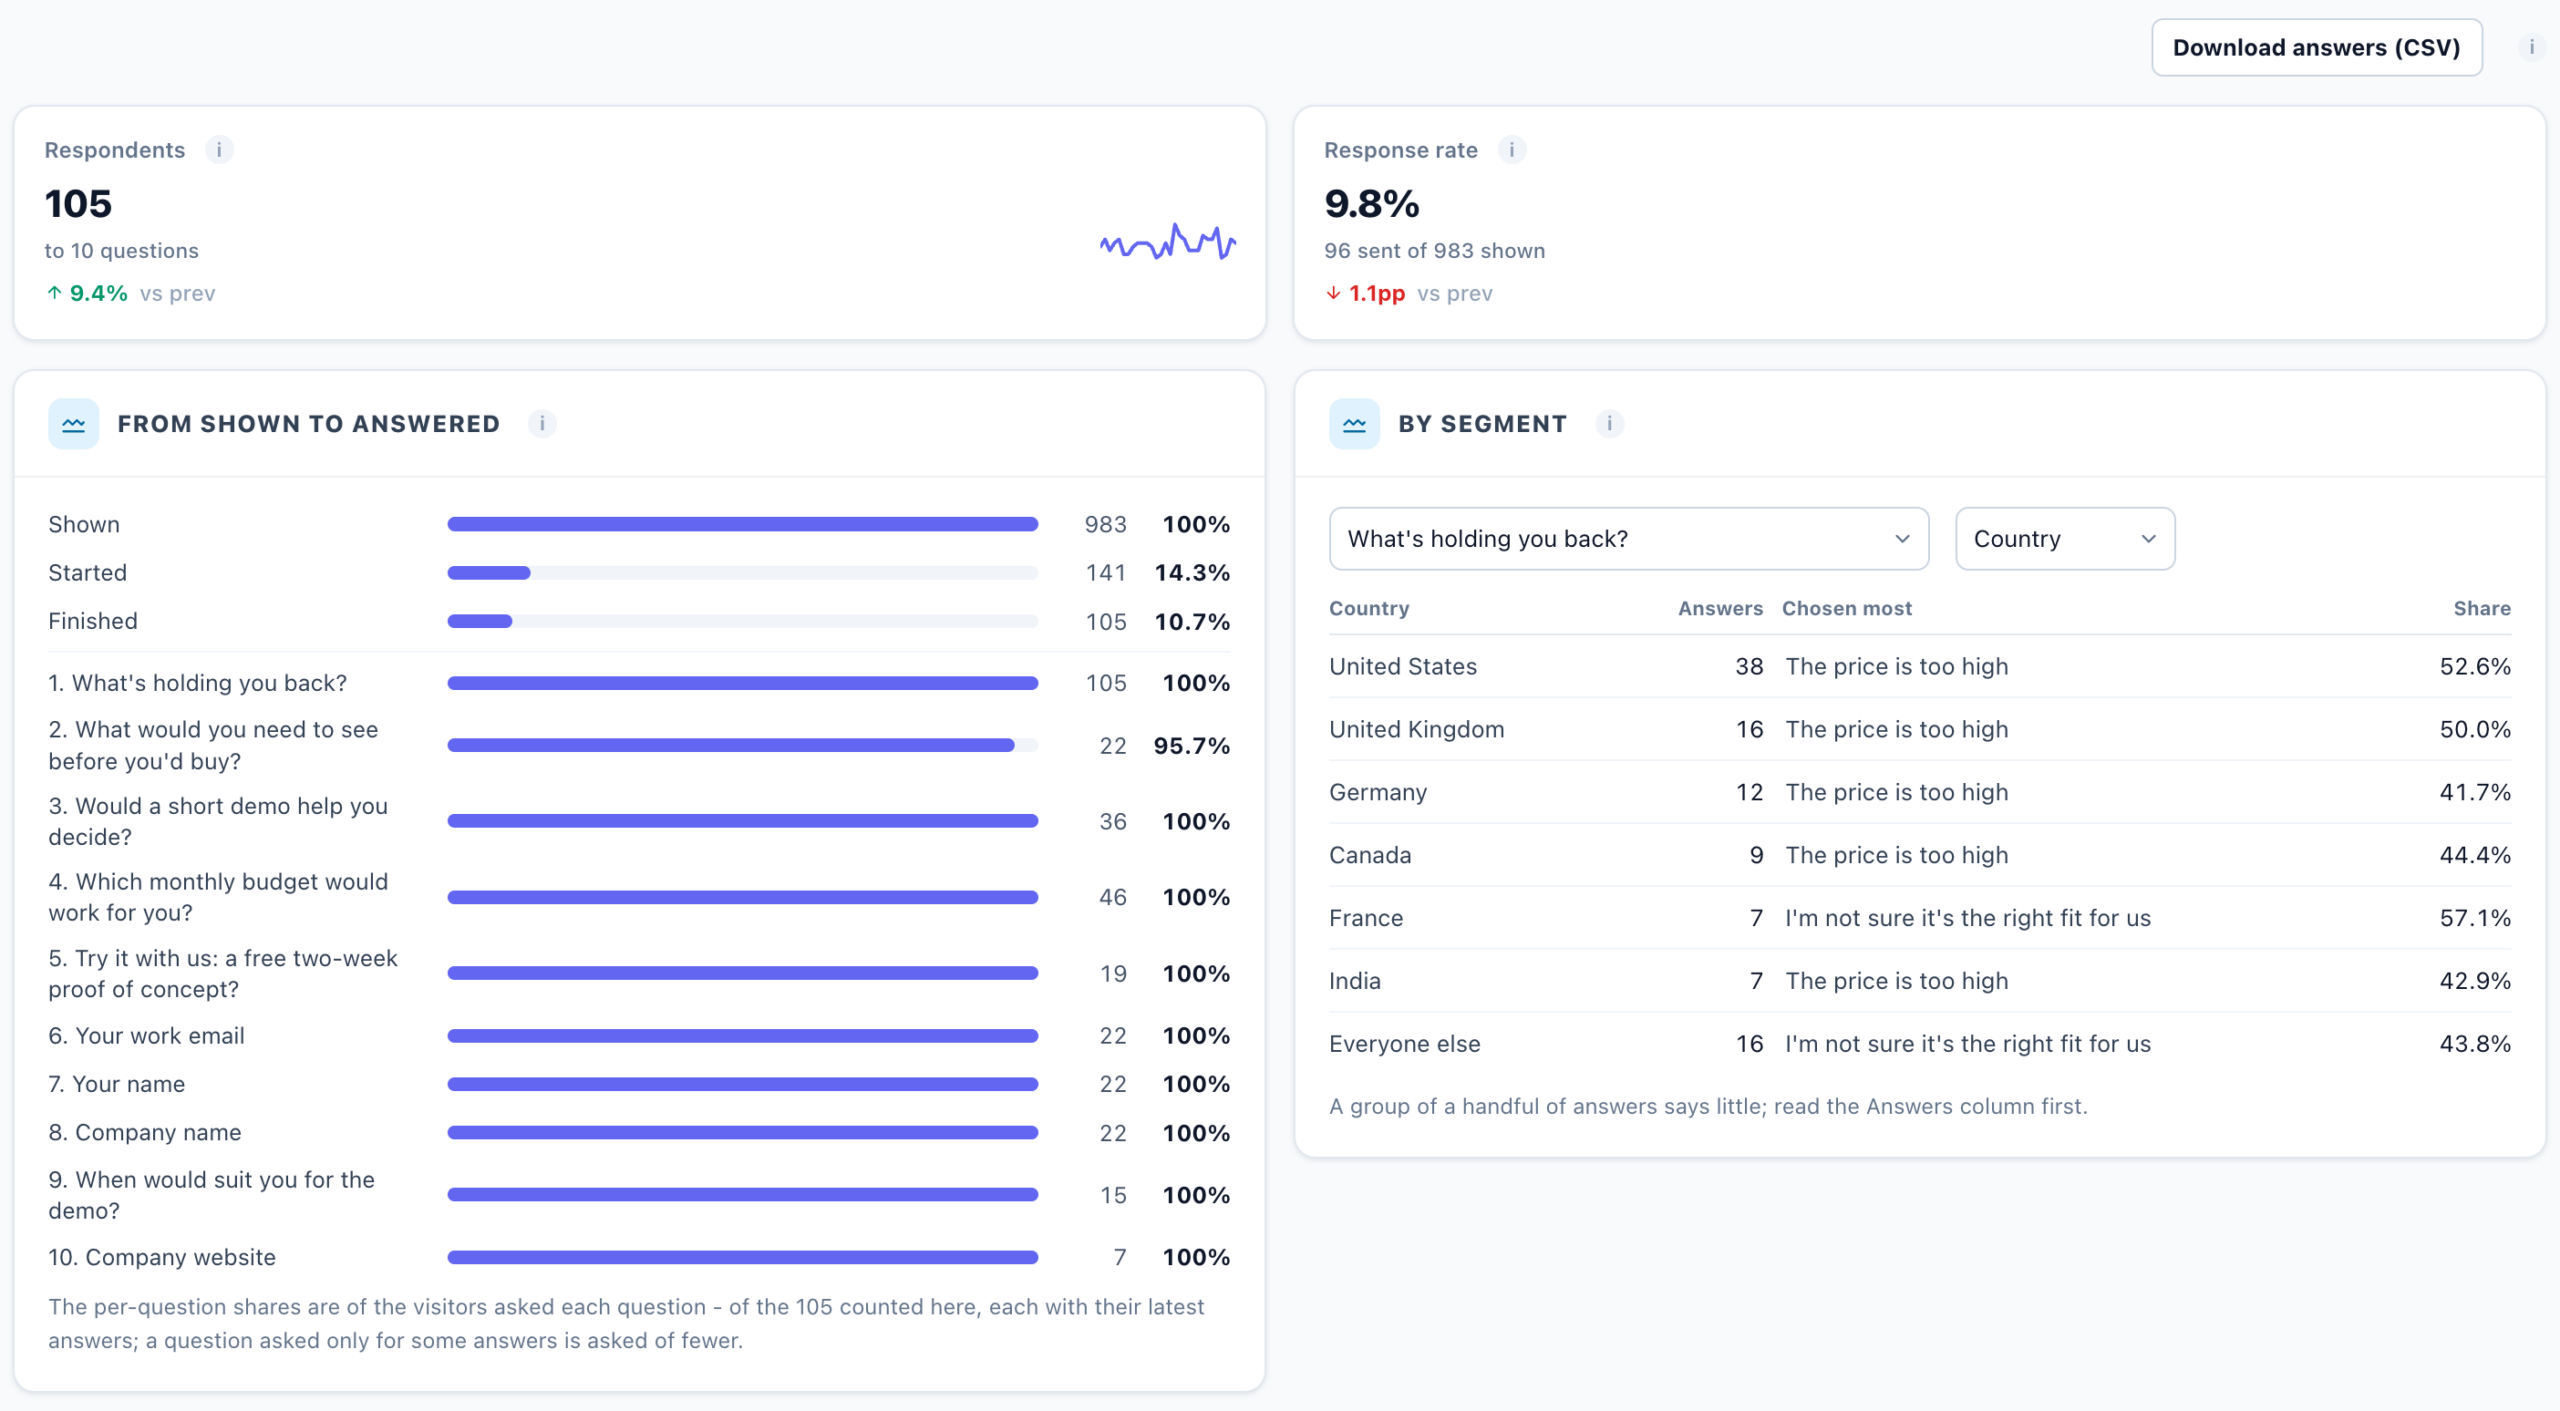
| Respondents | Visitors who answered in the period, each counted once, with their latest answers. The line is per day. On a survey page that counts answers at once, it also says how many did not finish. |
| Response rate | “{sent} sent of {shown} shown” — of the visits in which the survey was confirmed on screen, the share in which it was sent. Shown counts update every few hours. It counts your website only: answers given on the survey’s page, through a link or in an email are in Respondents but not in this rate. |
| NPS | When the survey has a 0–10 question: the share of promoters (9–10) minus the share of detractors (0–6), from −100 to +100. |
| Average rating | When the survey has a 1–5 rating question: the average stars. |
Each tile shows the change against the period of the same length just before.
From shown to answered
Shown (visits in which the survey was confirmed on screen) → Started (visitors who answered at least one question) → Finished (those who sent it), then, per question, how many of the visitors asked it answered it. A question that is not required can be skipped, and one asked only for some visitors (survey logic) is counted against those it was asked.
Where visitors stop
Of the visitors who started, how many stopped at each question without sending — the question on their screen when they left — as a share of all who started. Answered everything, did not send is its own line. The survey saves the answers so far as a visitor moves on, so a visitor who comes back can continue where they left off.
Where it was answered
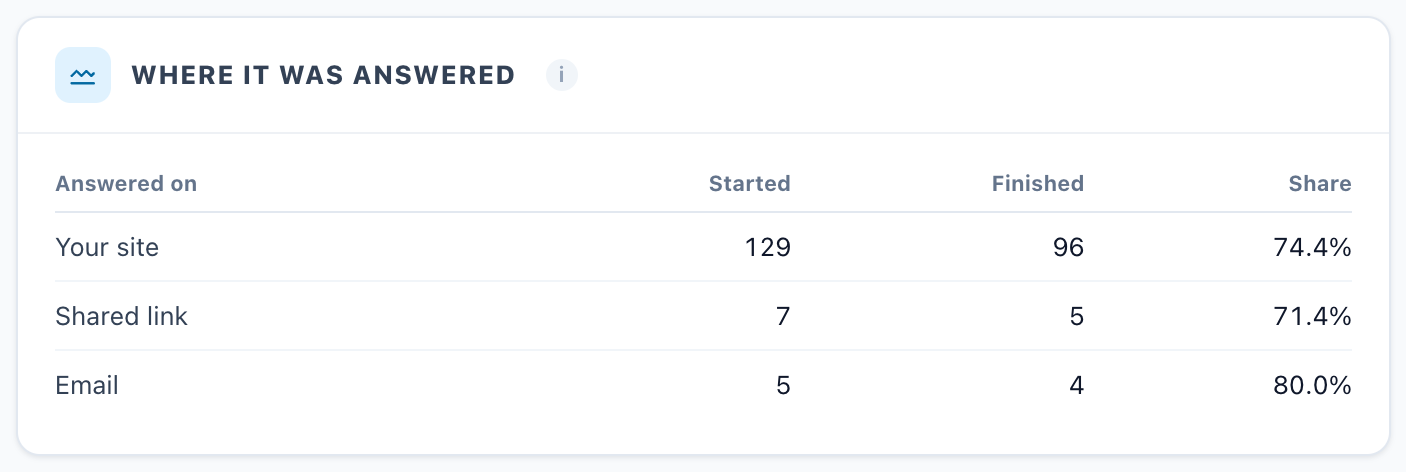
Shown when a survey was answered anywhere but your site: the visitors who started, by where they answered it, with Started, Finished and Share.
| Row | Where the visitor came from |
|---|---|
| Your site | The survey placed on your website. |
| Survey page | The survey’s own page, opened from its plain address (no pz_src). |
| Shared link, Social, Ads, Print, App | A link to the page marked with pz_src: link, social, ad, print, app. |
| QR code, Text message | The page’s QR code and text-message link. |
| A tap in a Personyze survey email. | |
| Another email tool | A tap in the code pasted into another email tool. |
By segment
One question’s answers, Split by Country, Device, Traffic source or Page — the biggest groups first. For a choice question, the answer chosen most in each group and its share; for a rating or 0–10 question, the average (and the NPS). A group of a handful of answers says little: read the Answers column first.
One card per question
- Choices — each choice’s share of the visitors who answered. With several choices allowed, the shares add up to more than 100%.
- Rating 1–5 — the average and how many gave each number of stars.
- Scale 0–10 — the NPS and the average, with Promoters 9–10, Passives 7–8 and Detractors 0–6.
- Written answers — the newest ones, and the AI summary.
- A survey that keeps a score has a Survey score card: the average, the lowest and the highest, and How the scores spread — how many visitors scored in each band.
- A question with “Other (please specify)” adds Other, in their words: what the visitors who chose it wrote.
- An Email or a Date question lists the newest addresses or days given; the export has them all. Addresses are for you only.
A question you removed from the survey keeps its card, tagged No longer asked; a choice renamed or removed since it was given is listed after the current ones as a former choice.
Latest written answers
When the survey has at least two written questions, one more card lists the newest written answers across all of them. The CSV has them all.
The AI summary
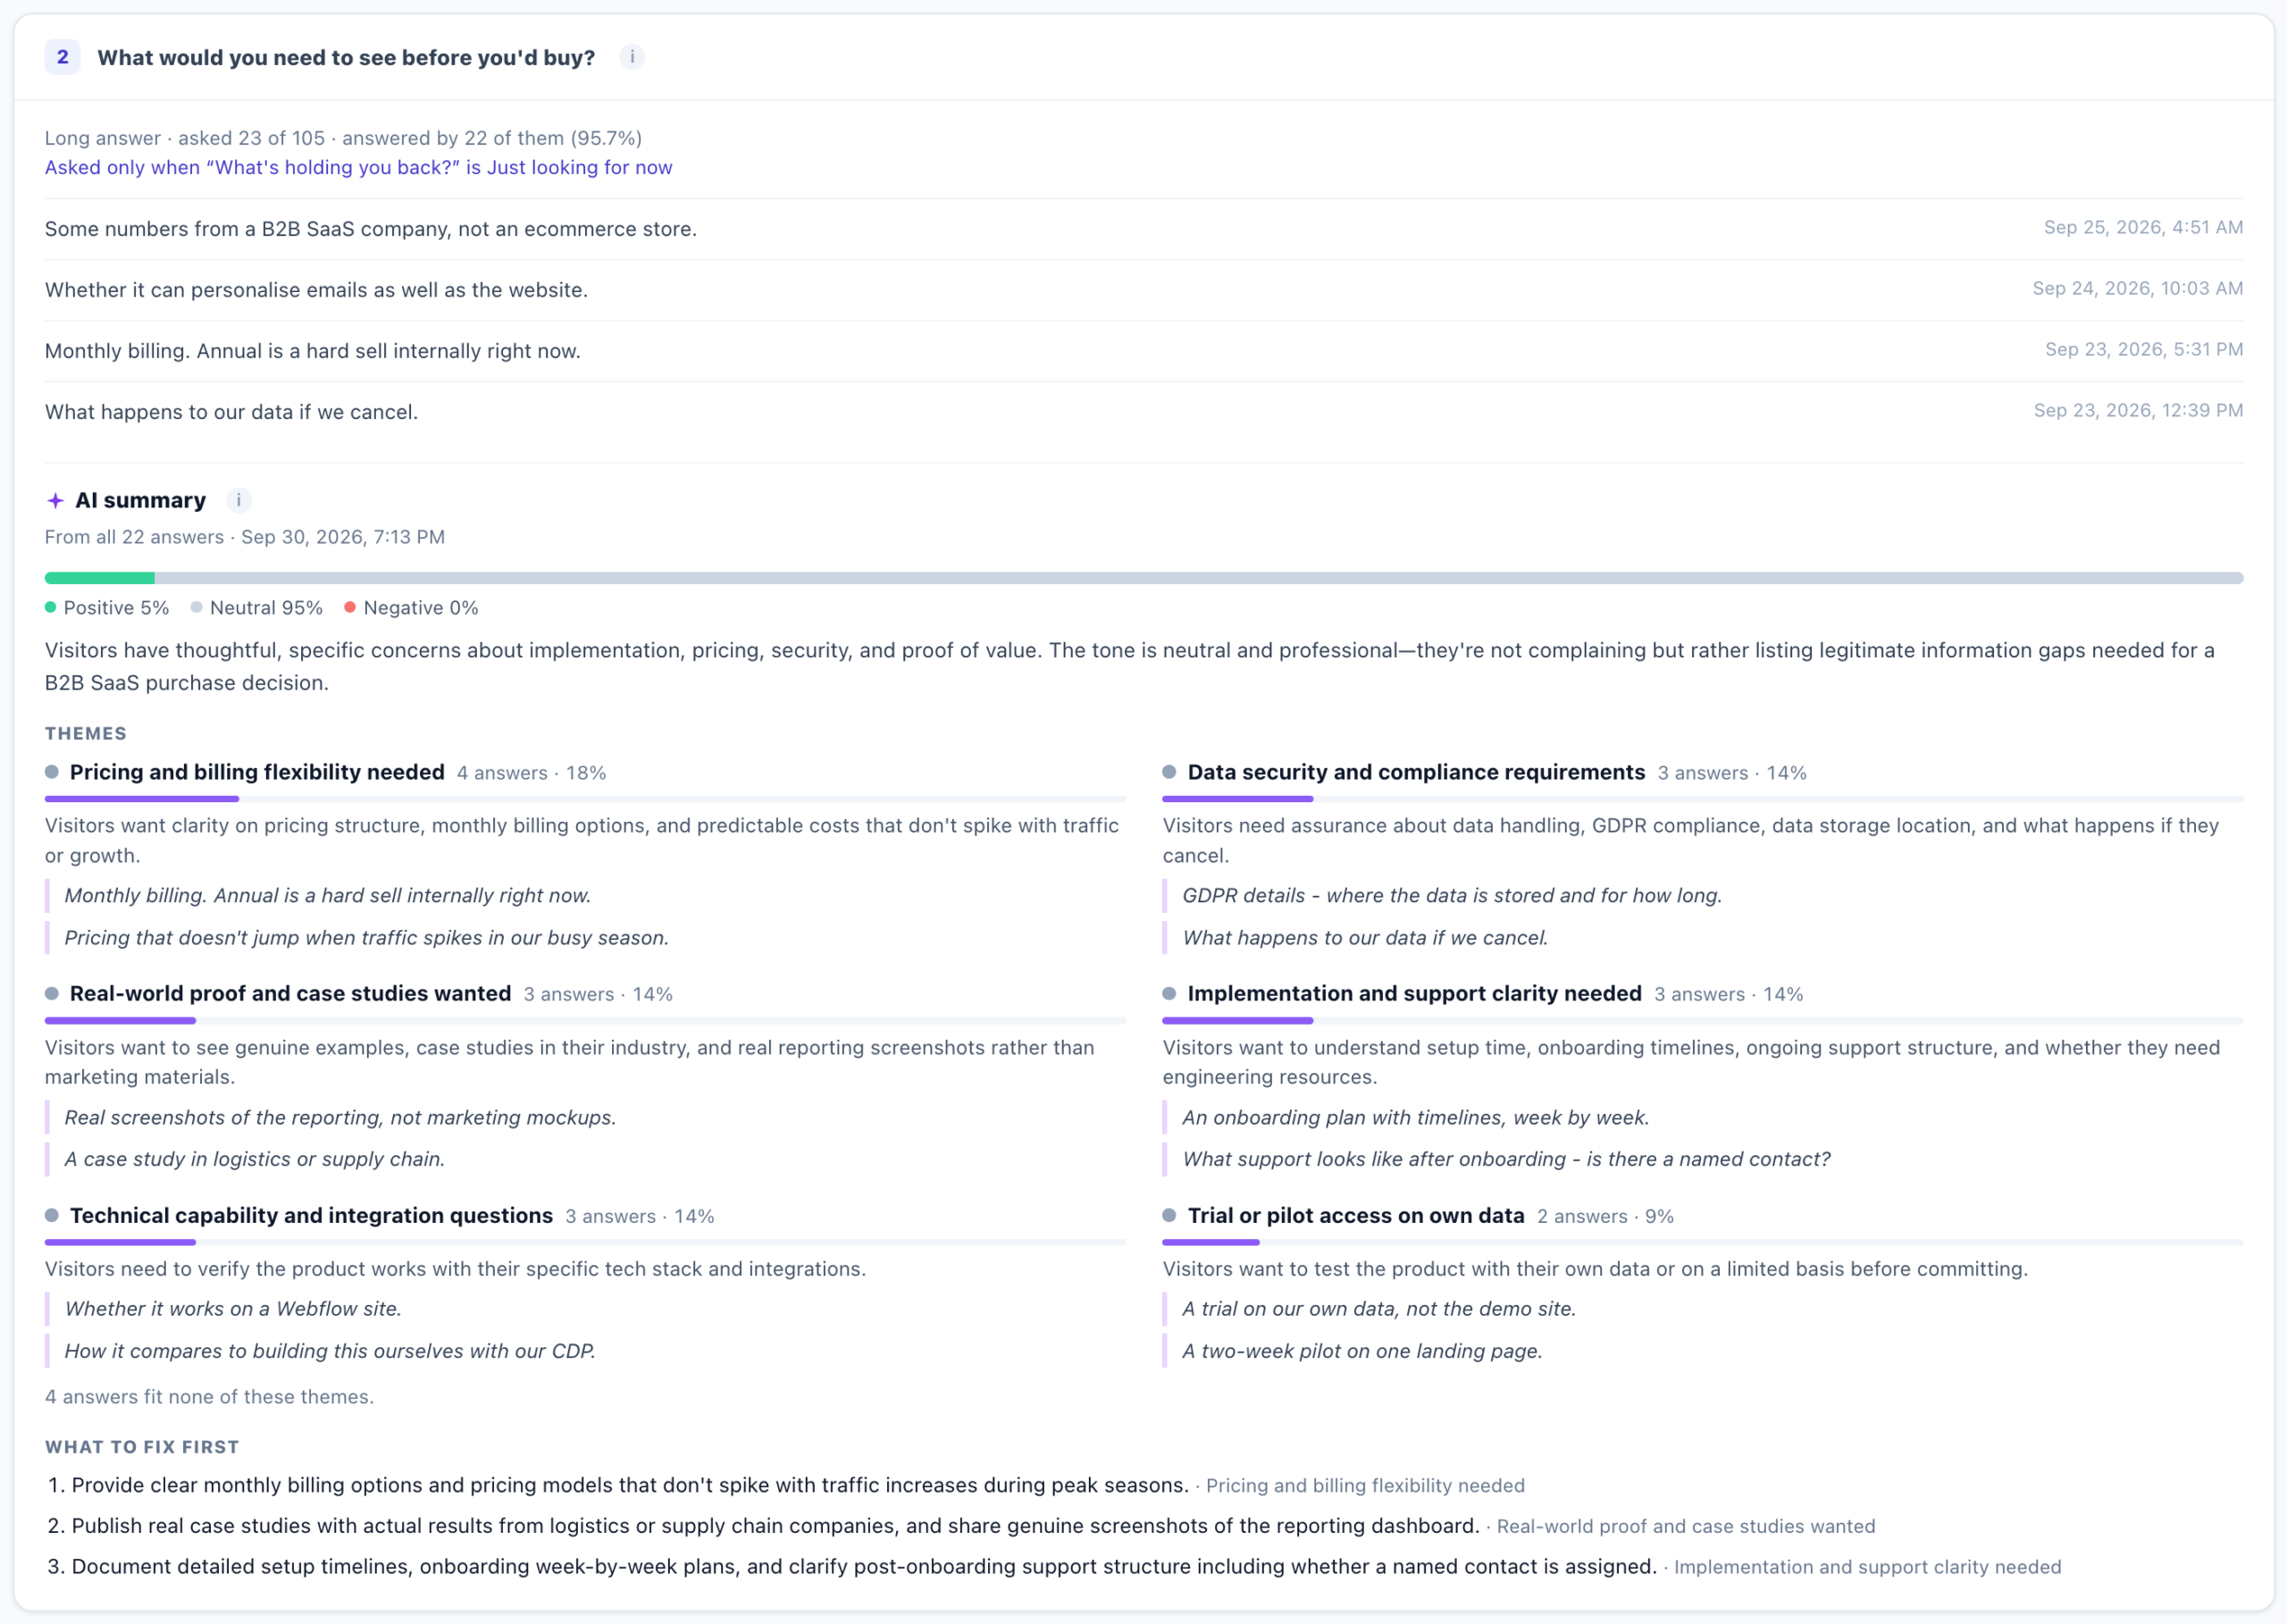
On a written question’s card, click Summarise the written answers. The AI sorts the answers into Themes — how many answers said each, with one or two in the visitor’s own words — gives the overall mood as Positive, Neutral and Negative, and ends with What to fix first.
- It needs at least 3 written answers, and reads the newest 200.
- Only the answers’ words are sent, never who wrote them; email addresses and phone numbers are taken out first.
- The summary is kept, so opening the report again costs nothing. When newer answers have arrived, a Refresh button appears.
- Making one uses the account’s AI credits (see Billing).
Possibly automated answers
An answer is flagged possibly automated when it was sent faster than anyone could answer (under a second a question), when an email scanner tapped every answer of an email, when the survey’s hidden trap field was filled, or when it came from someone whose address differs from the one another email tool’s link gave. Flagged answers are stored and delivered to your destinations as usual; the report leaves them out of every figure unless you tick Include possibly automated.
A survey email’s own Performance
An Email & SMS campaign whose email carries a survey — a Survey by email — adds two stages to its delivery funnel: Answered (recipients who came from this email and answered at least one question, measured against Sent) and Finished (those who went on to the end). Possibly automated answers are left out.
When the numbers arrive
- Answers are counted as they come in.
- Shown, and with it the response rate, comes from the daily campaign statistics, usually within one to three hours of the visit.
The Reviews, Feedback and Surveys tabs together: Reviews, Feedback & Survey Reports. Every other number on the Performance step: Performance Metrics.
Related
- Surveys
- A survey’s own page, QR code and survey emails
- Worked example: an exit survey on a pricing page
- Troubleshooting — answers missing from the report