
Every screen in Personyze that reports a number, on one page: what each number counts, where it comes from, and how to read it. Start with the rules every number follows, because a handful of words (Viewed, conversion, attributed revenue) mean the same thing everywhere, and most misreadings come from mixing two of them up.
The screenshots are from a demo store account, so the figures are illustrative.
Two videos walk through the reports:
Traffic, the quality of those visits, what converted, and exporting it.
Create one, choose what it covers, and set when it arrives.
On this page
- The rules every number follows
- Account Overview
- Website traffic
- Campaign performance
- One campaign’s Performance step
- Product and content recommendations
- A/B and multivariate tests
- Audience Discovery
- Live visits and Campaign activity
- AI Chat
- Landing pages
- Forms
- Email, SMS, web push and 3rd-party emails
- Reviews, Feedback and Surveys
- Getting the numbers out
- Reading a result honestly
The rules every number follows
These terms are used the same way on every screen below, unless a section says otherwise.
| Term | What it counts | How to read it |
|---|---|---|
| Viewed | Times a visitor had the content on screen: at least two thirds of it in view, or shown over the page. A click, close or conversion on it also counts as a view. | The main exposure number. When you ask “how many people saw it”, this is the answer. |
| Sent | Times the content was sent to the page, including pages where it had nothing to show or no place to appear. Older reports called this Impressions. | Sent far above Viewed means the content often rendered below the fold, or had nothing to show. |
| Ran | Times an action that cannot be seen ran: a script, a redirect, a feed, an email, SMS or webhook step. | Never part of Viewed. A campaign made only of such actions leads with Ran instead. |
| Clicks | Clicks on a campaign’s clickable element (a button, a product tile). Repeat clicks in one visit all count. | A survey, review, feedback answer or lead form that was sent is a form submission, not a click. |
| CTR | Clicks ÷ Viewed, counting only views of things that can be clicked. | A dash means nothing clickable was viewed in the range. |
| CTR of visit | Visits with at least one click ÷ visits in which the content was viewed. | The fairer rate for comparing campaigns: one visitor clicking ten times cannot inflate it. |
| Conversion | A visit that reached any goal you defined, or bought a product. | Counted per visit. A visitor matched by three campaigns converts once in each of them, so never add conversions across campaigns. |
| Conversion rate | Converting visits ÷ visits. | Compare rates, not counts, between campaigns of different sizes. |
| Product revenue / Audience revenue | Products bought (quantity × catalog price) in the visits of the visitors a campaign matched, whether or not they touched the campaign’s content. | The audience view. It is not what the campaign earned, and it is not additive: one order counts in every campaign the buyer matched. |
| Attributed revenue | Recommended items that were bought after the visitor clicked them in a recommendation widget, valued at quantity × catalog price. | The only revenue credited to a campaign. It counts the recommended items, not the whole order. |
| Contribution | Attributed revenue ÷ total product revenue. | How much of the store’s sales the recommendation widgets drove. |
Account Overview: how is the account doing?
Where: Home. The top-line view of the whole account over the reporting range.
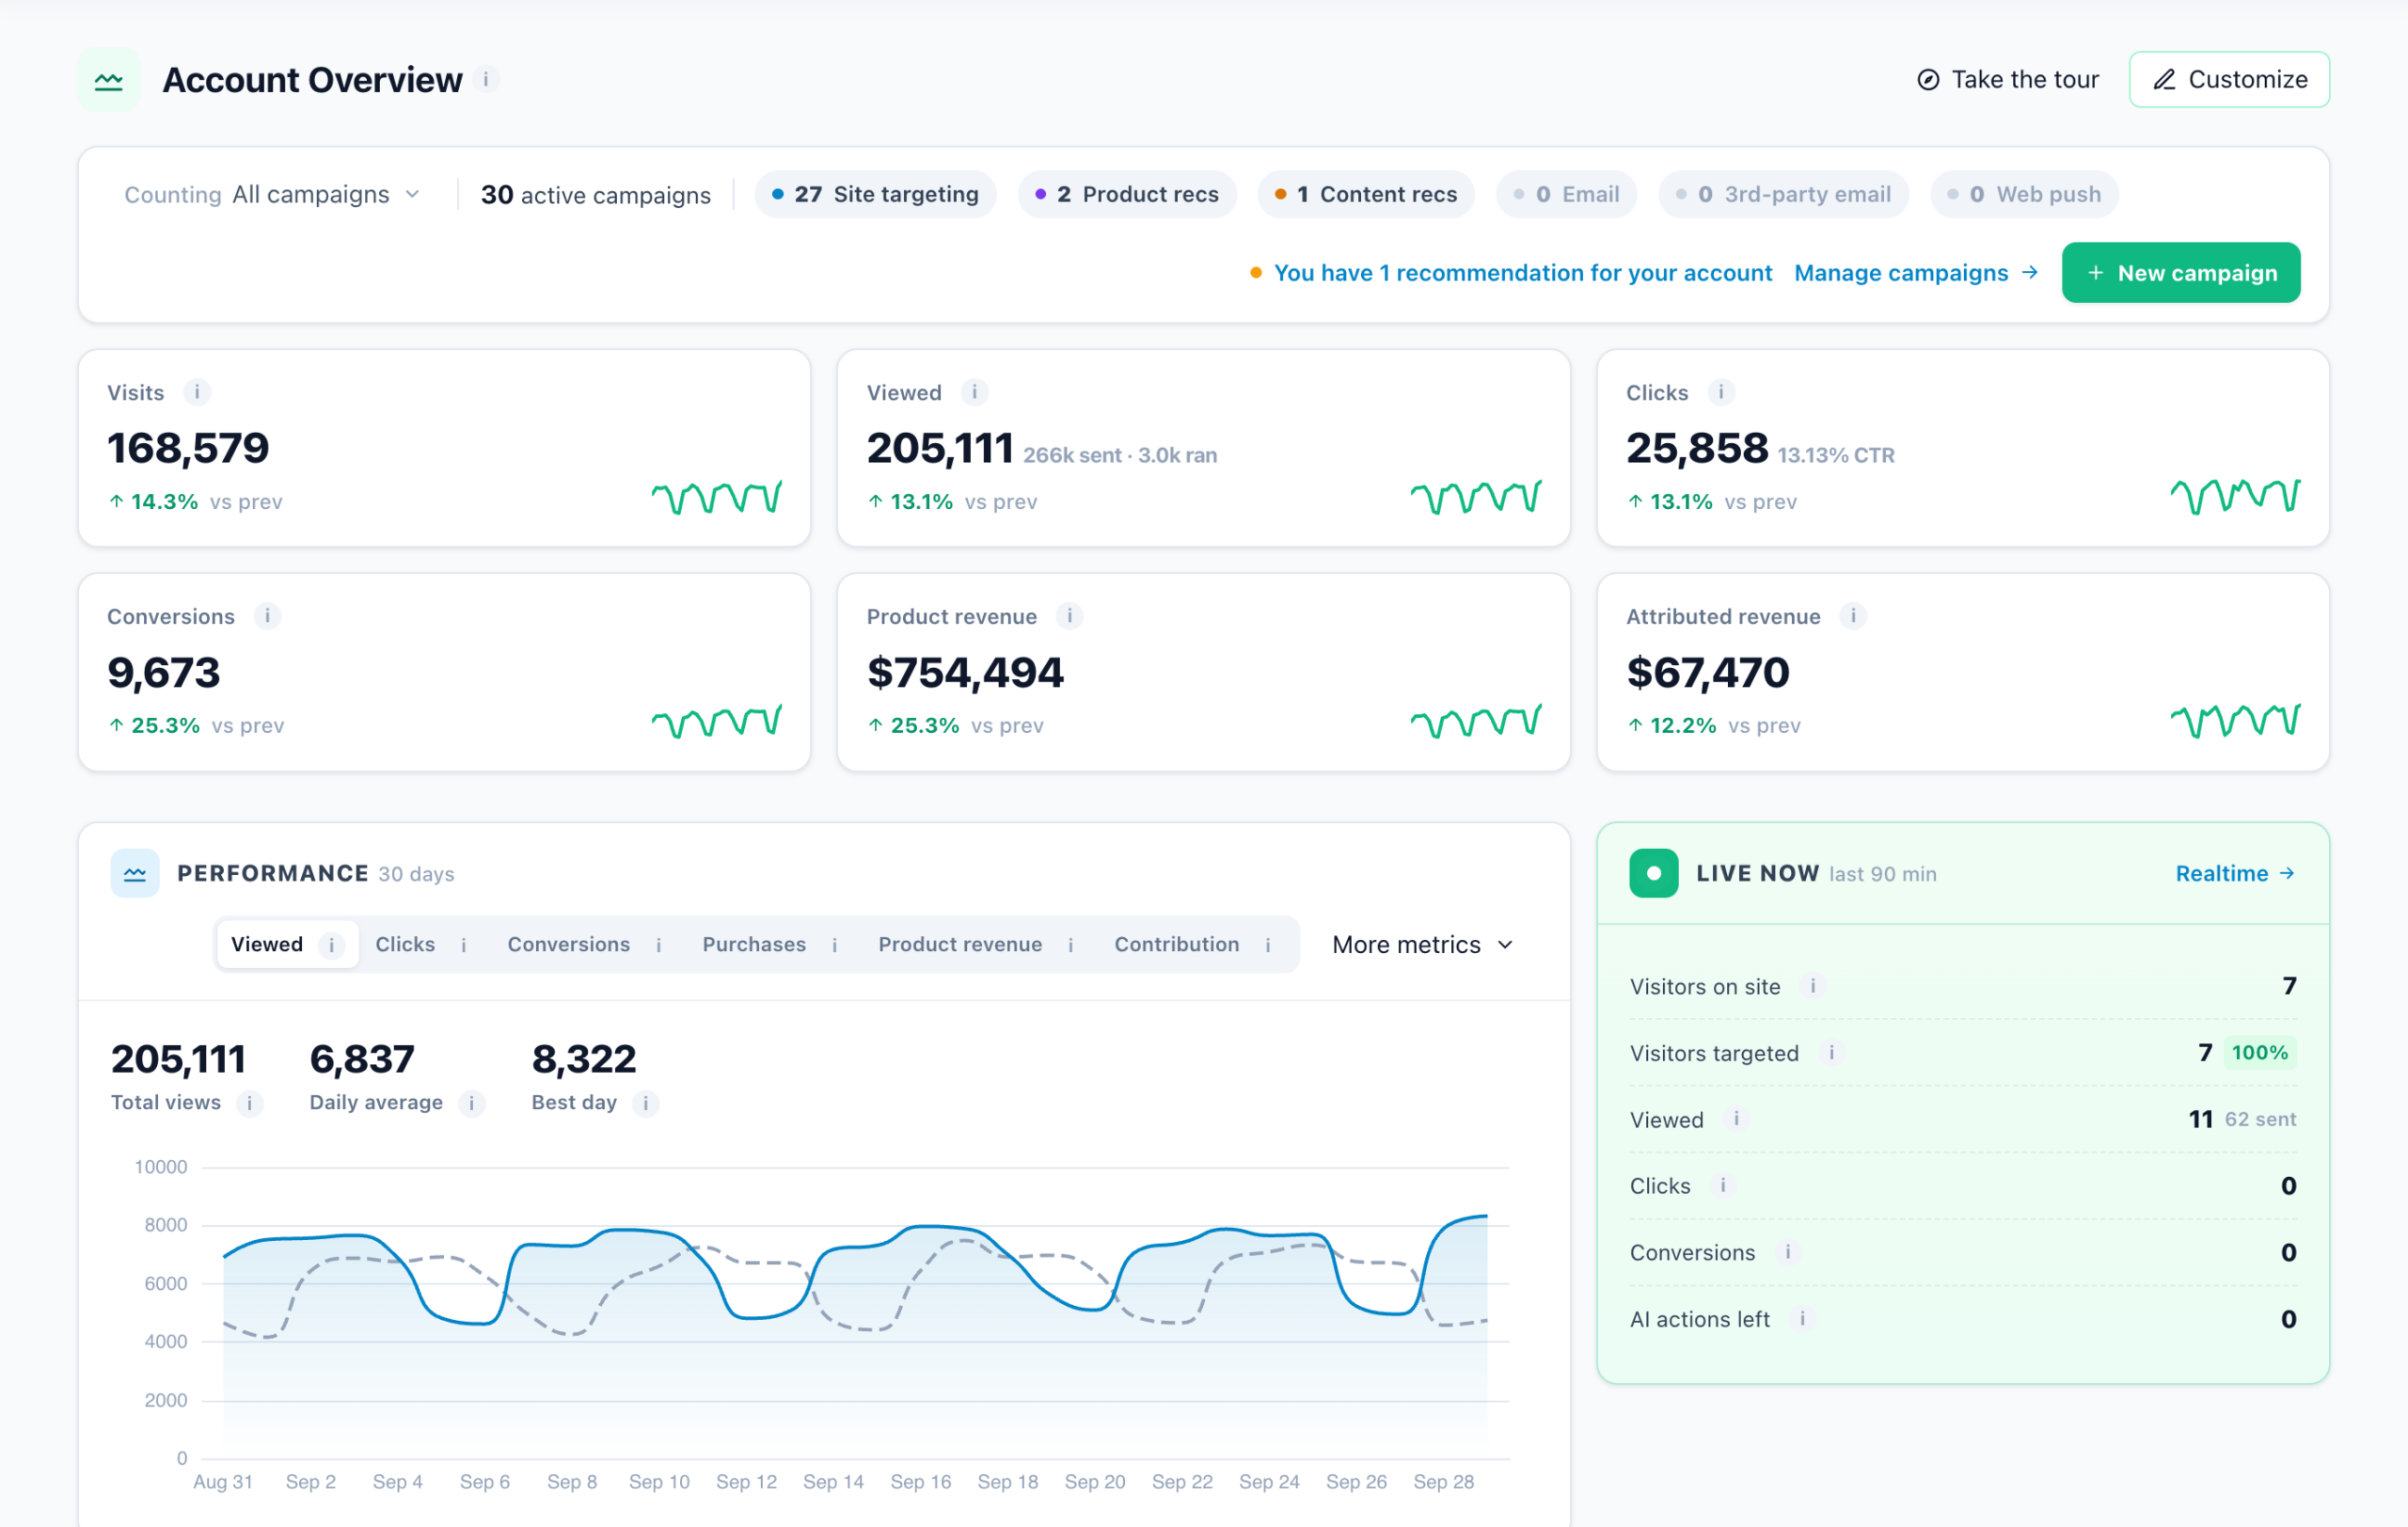
| Tile | What it counts |
|---|---|
| Visits | Every visit to the site in the range, campaign or not. |
| Viewed | Views of every campaign’s content, with Sent and Ran beside it. |
| Clicks | Clicks on campaign content, with the CTR. |
| Conversions | Visits that reached a goal or bought something, anywhere on the site. |
| Product revenue | Every product purchase on the site, priced from your catalog. Site-wide, not attributed to any campaign. |
| Attributed revenue | What the recommendation widgets themselves earned. |
- Performance charts any of those numbers day by day. Daily average and Best day sit above the chart. For a rate, the average is the totals divided once, not an average of the daily rates.
- Live now covers the last 90 minutes: visitors on the site, how many a campaign targeted, and their views, clicks and conversions.
- Top performing campaigns ranks campaigns by clicks, audience revenue, CTR, purchases or conversions. Read its revenue column as the audience view. The Attributed revenue column only has a figure for campaigns with a recommendation widget.
- Performance by channel shows views, clicks and the average conversion rate per channel. It shows no summed conversions, because one visitor often matches campaigns in several channels.
- Needs attention flags two things:
- a live campaign with no views for two days;
- a CTR that dropped by 40% or more week on week. This needs at least 500 views in both weeks and 20 clicks in the earlier one.
Customize turns this layout into your own dashboard: pick the cards, scope them to particular campaigns, share it, show it on a wallboard or have it emailed. See Dashboards.
Website traffic: the site itself, with or without campaigns
Where: Analytics → Website traffic. Your property’s own traffic, available on every account.
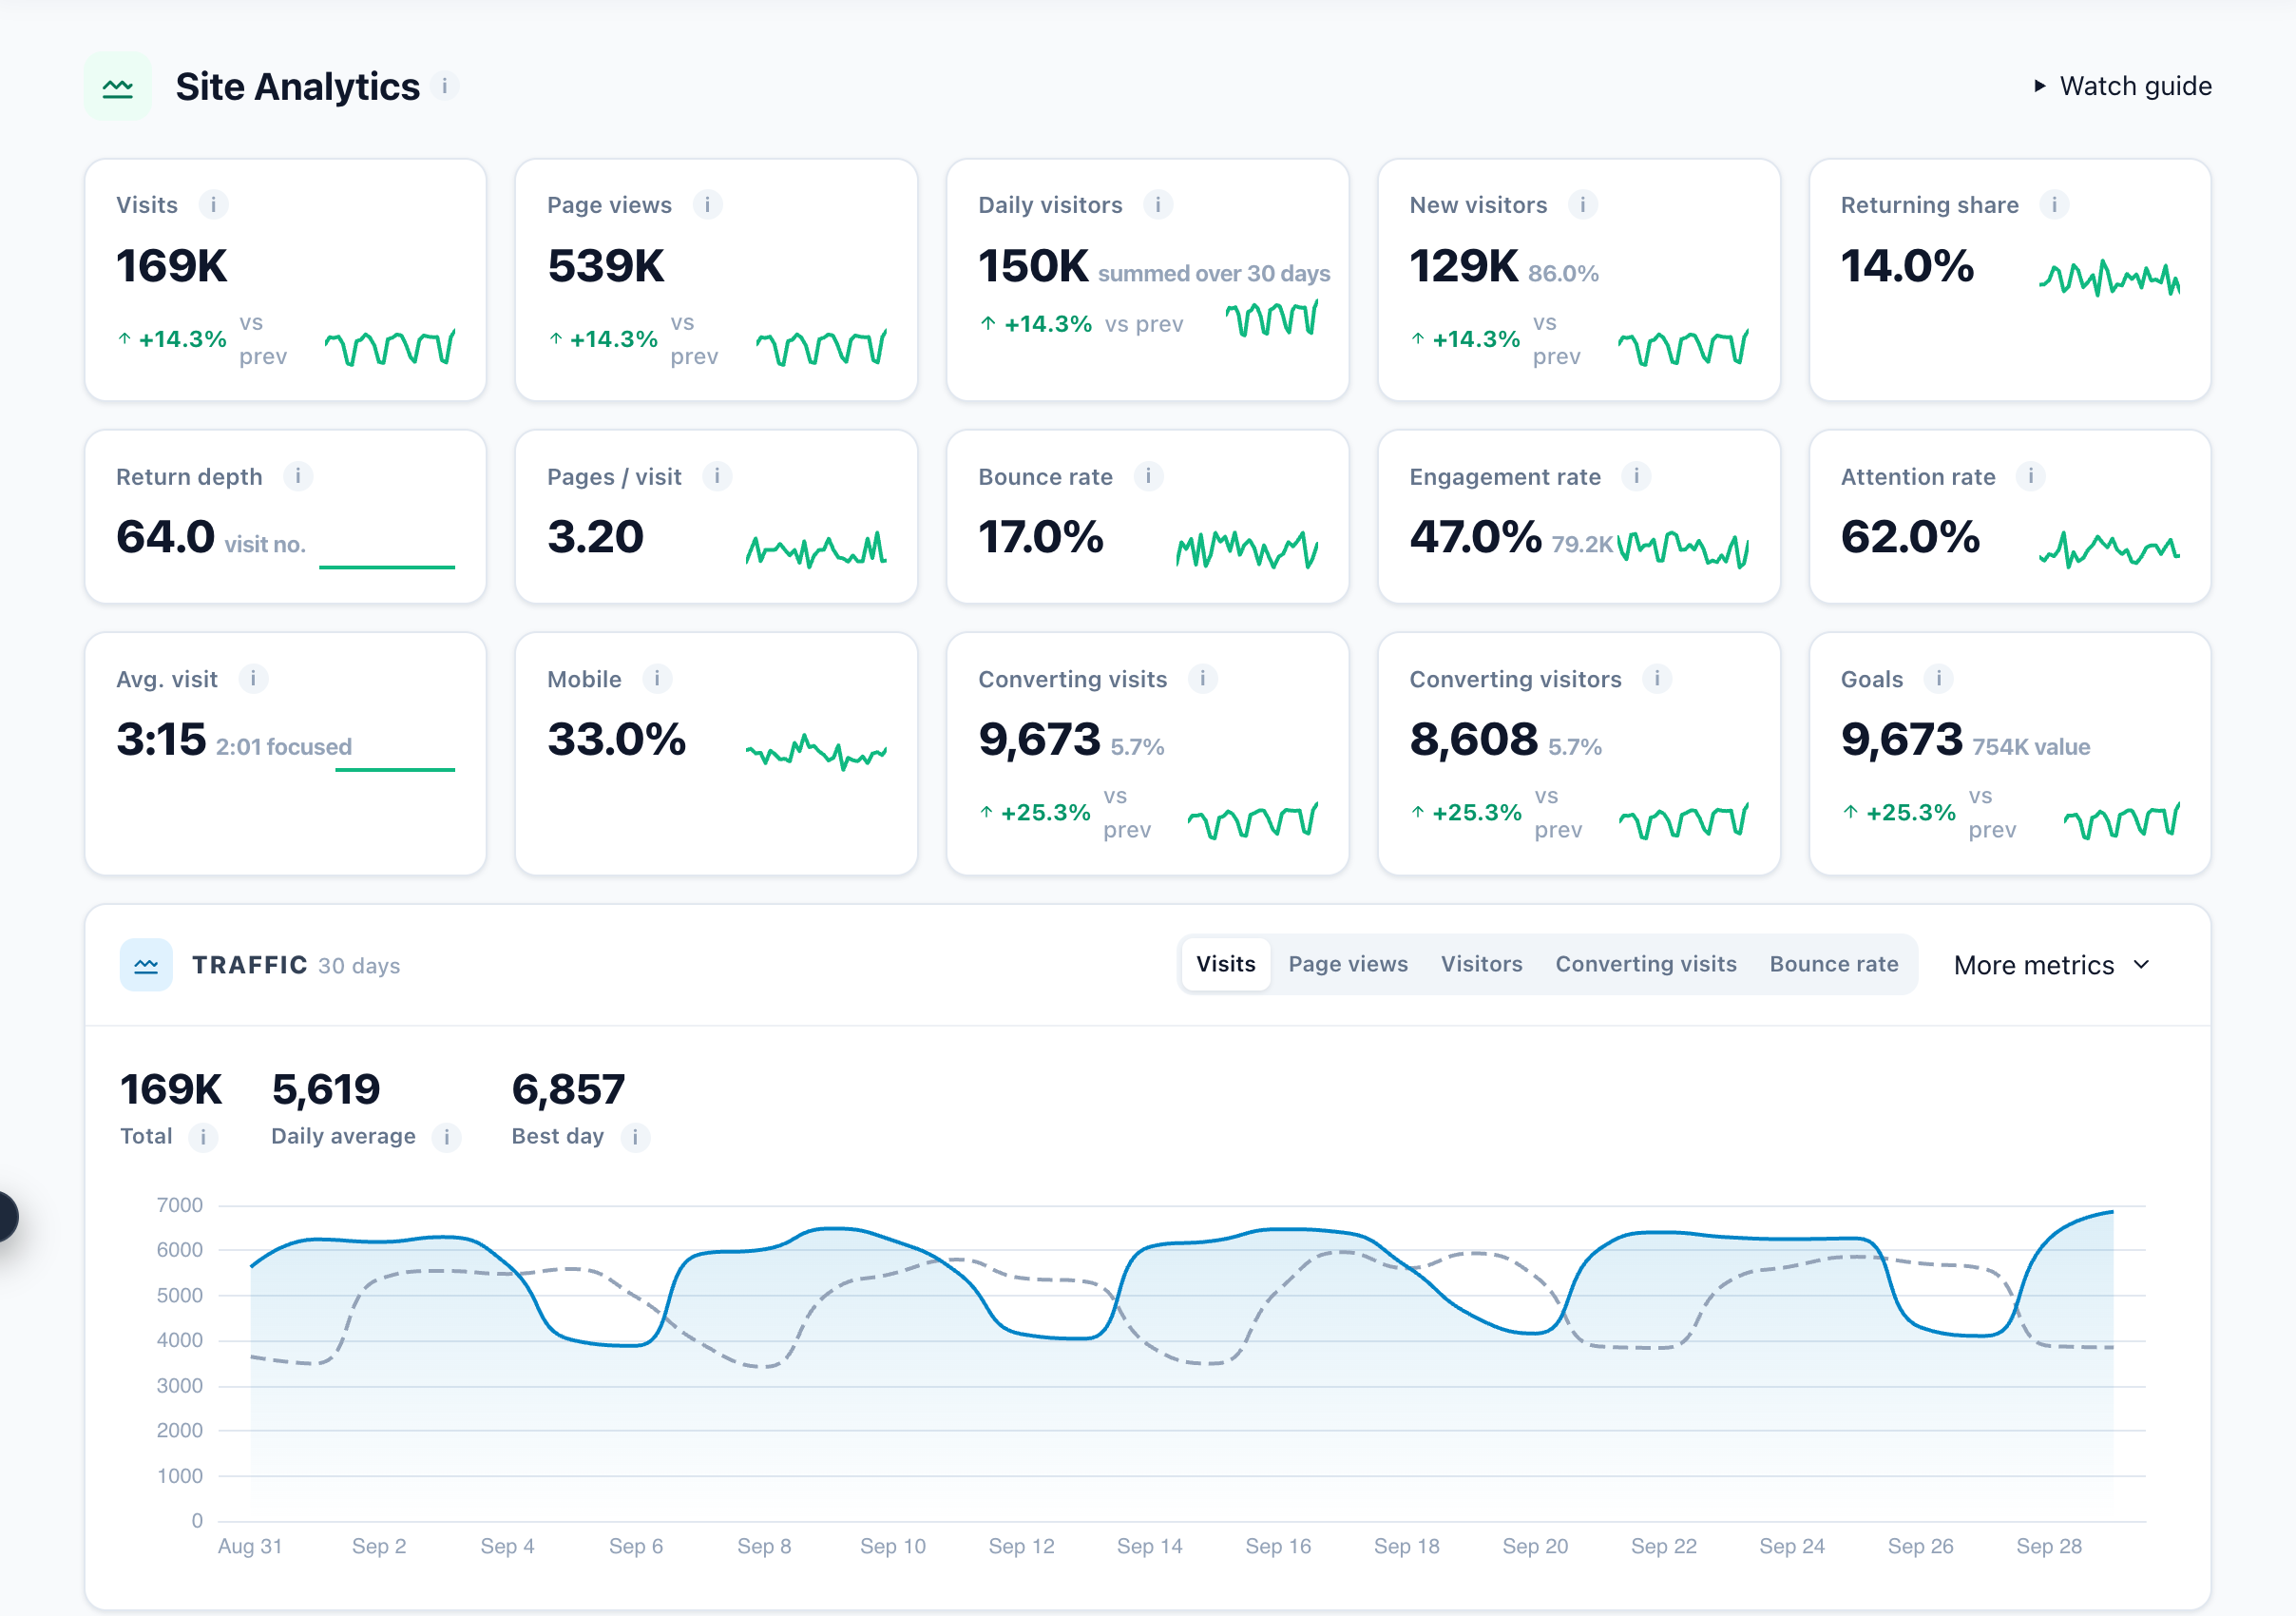
| Tile | What it counts | How to read it |
|---|---|---|
| Visits · Page views | Visits to the site, and pages loaded with Personyze on them. | |
| Daily visitors | Distinct visitors per day, added up over the range. | Someone who visits on five days counts five times, so this is higher than the number of people. |
| New visitors | Visitors on their first visit. | An exact count of people: a visitor is new on exactly one day. |
| Returning share · Return depth | Returning visitors as a share of daily visitors; the average visit number (1 = first visit). | A high return depth is an audience that keeps coming back. |
| Pages / visit · Avg. visit | Page views ÷ visits; time per visit, with the focused part beside it. | |
| Bounce rate | Visits that saw one page and did nothing on it. | Stricter than the campaign screens’ bounce rate, which counts every single-page visit. |
| Engagement rate · Attention rate | Visits whose tab was focused and in use for more than a minute; the share of open time the tab was focused. | Better signals of real attention than time on site. |
| Mobile | Share of visits from phones and tablets. | |
| Converting visits · Converting visitors · Goals | Visits that reached a goal or bought; converting visitors per day; goal events with their value. |
The breakdowns below the chart (referrers, landing pages, browsers, countries) need the daily breakdown switched on for your account. If a card says the dimension is not being collected, that is a setting, not an empty result. Ask support to switch it on.
Campaign performance: every campaign, or one
Where: Analytics → Campaign performance. Whole site adds up every on-site campaign; Specific campaign narrows to one, and then to a single action.
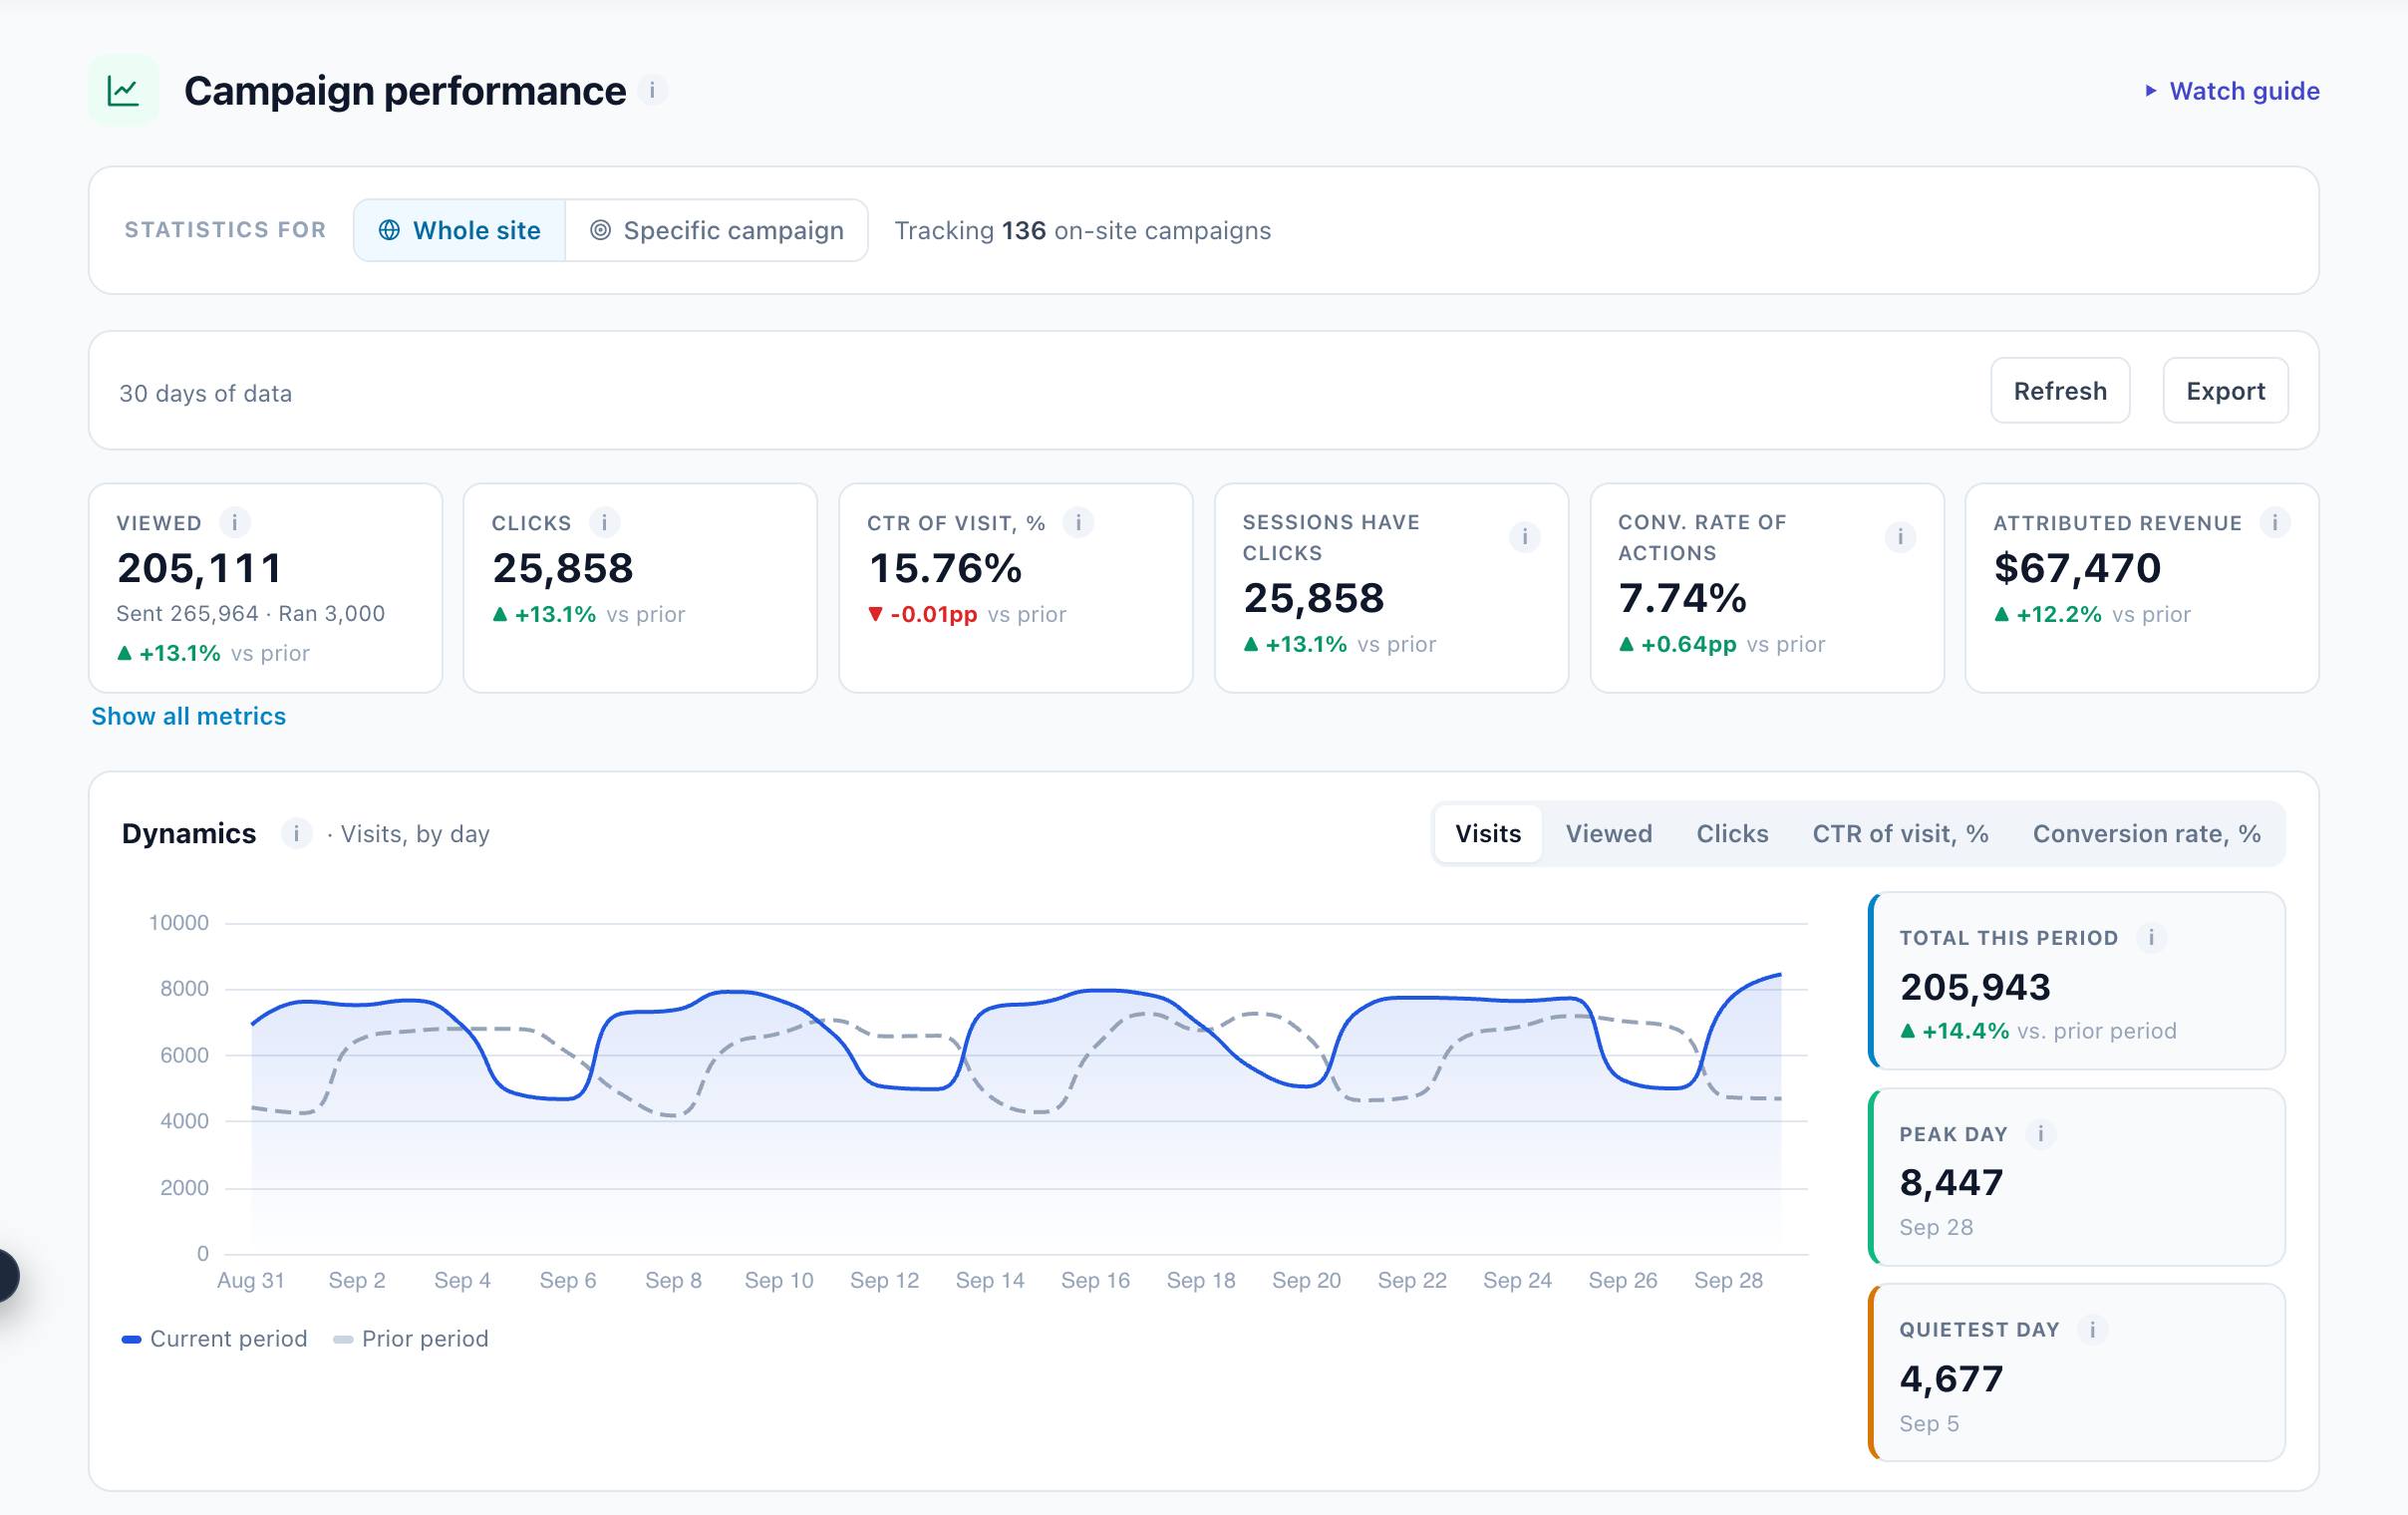
| Figure | What it counts |
|---|---|
| Viewed | Views of campaign content, with Sent and Ran underneath. |
| Clicks | Clicks on clickable campaign content. Form submissions are not included. |
| CTR of visit | Visits with a click ÷ visits in which the content was viewed. The safer rate to compare campaigns by. |
| Sessions have clicks | Visits with at least one click. |
| Conv. rate of actions | Converting visits ÷ visits. |
| Attributed revenue | What recommendation widgets in scope earned. |
| Show all metrics | Adds the plain CTR (inflated by repeat clicks), Audience revenue and Conversions. |
- Conversion goals shows each of your goals as a rate: visits that reached it ÷ visits.
- Engagement shows bounce rate (every single-page visit), pages per visit and visit length.
- Action performance & conversions breaks the numbers down per action. Performance by segment splits them by device, browser, operating system, country, page or action group.
One campaign’s Performance step
Where: open a campaign and go to its Performance step. The range buttons are From start, From last edit, From A/B test start, Since winners applied and Date range. The step opens on the top-bar range.
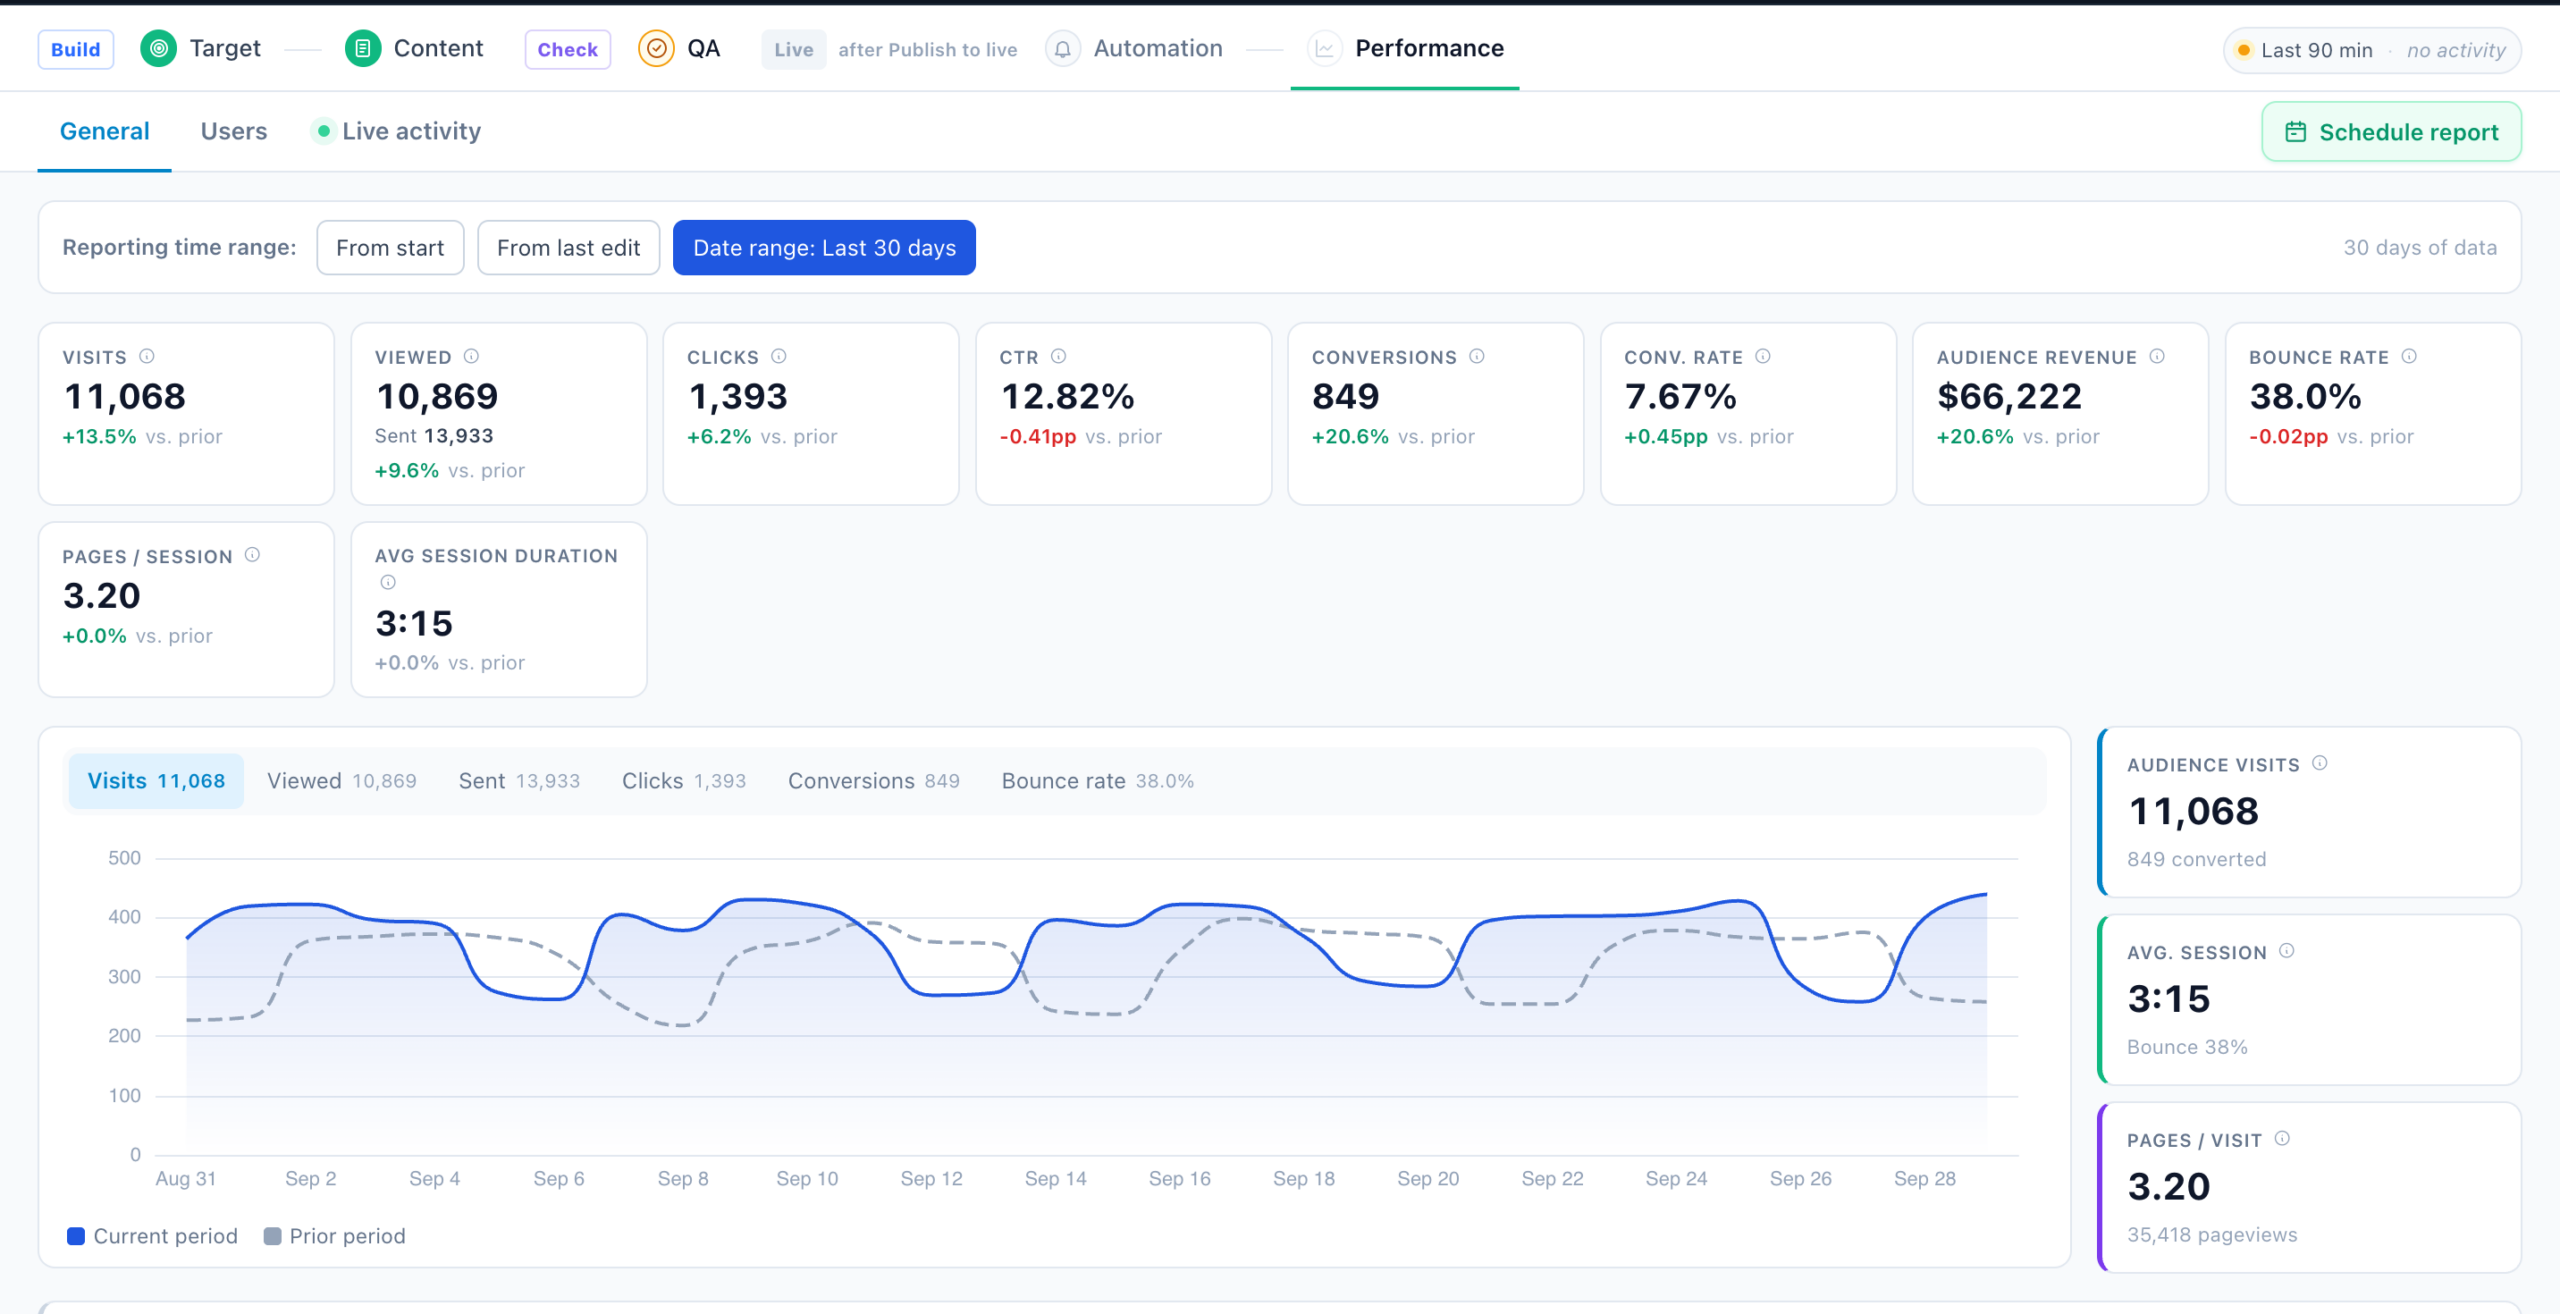
| Tile | What it counts |
|---|---|
| Visits | Visits of visitors who matched the campaign’s audience. They need not have seen its content. |
| Viewed · Clicks · CTR | The content itself: seen, clicked, click rate. |
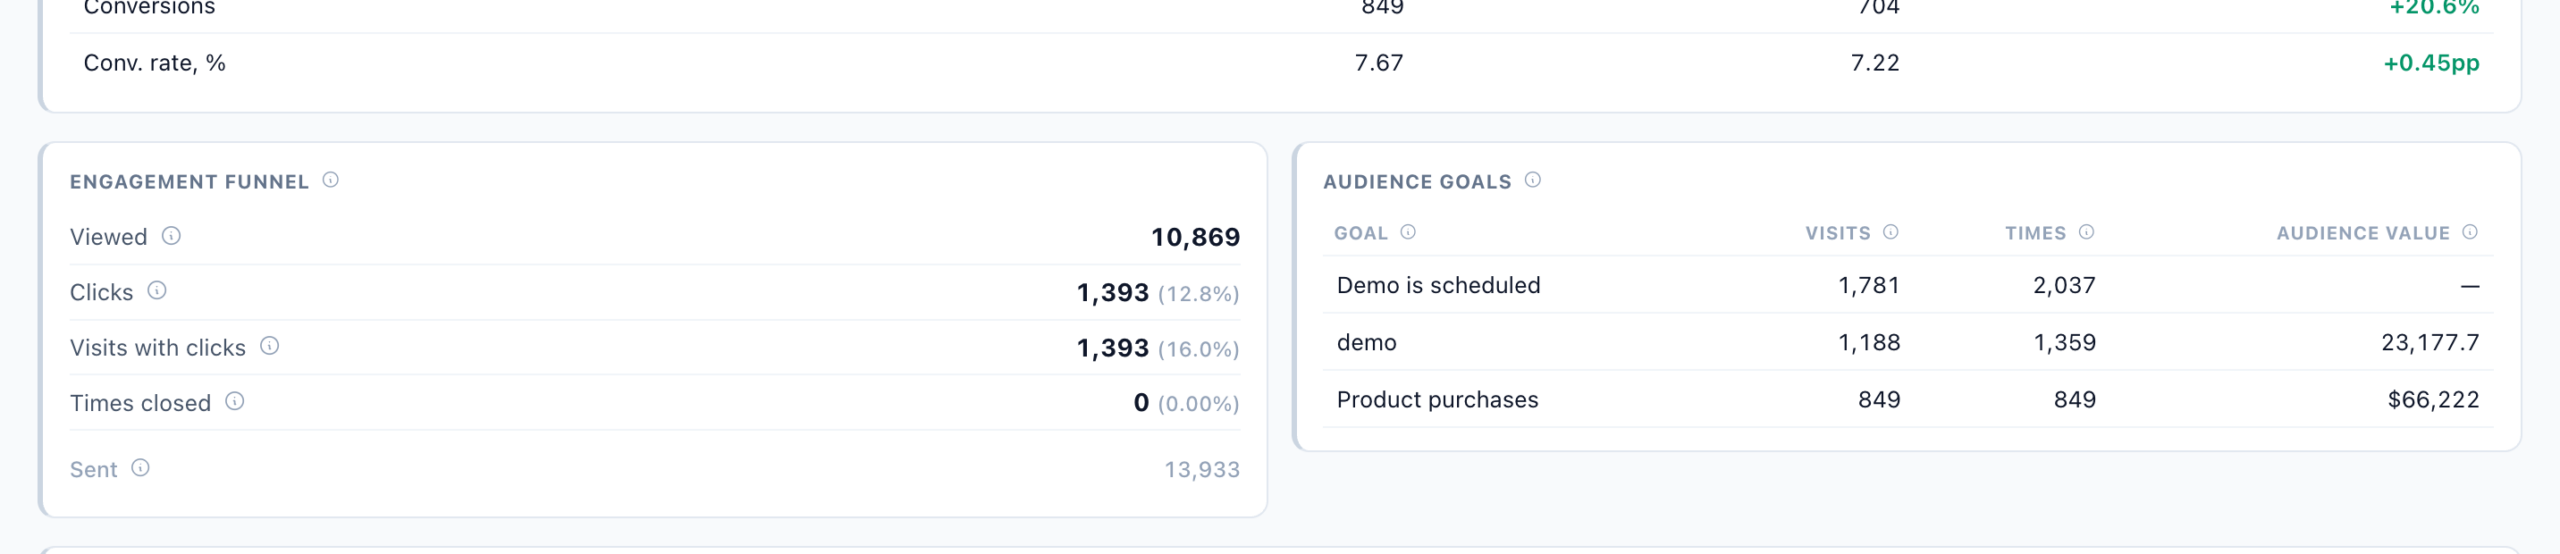
| Conversions · Conv. rate | Matched visits that reached a goal or bought, and their share of matched visits. |
| Audience revenue | What the matched visitors bought, whether or not the campaign caused it. Not additive across campaigns. |
| Bounce rate · Pages / session · Avg session duration | How the matched visits behaved. |
More tabs appear when the campaign carries the matching content:
- Conversations (AI Chat)
- Reviews, Feedback, Surveys
- A/B testing, Multivariate
- Recommendations
- Audiences, Users
- Forms
- Live activity
Schedule report emails this campaign’s figures on a schedule.
Product and content recommendations
Where: a recommendation campaign’s Performance step opens on its Recommendations tab. The same dashboard, for one campaign or all of them, is at Analytics → Product analytics → Recommendations.
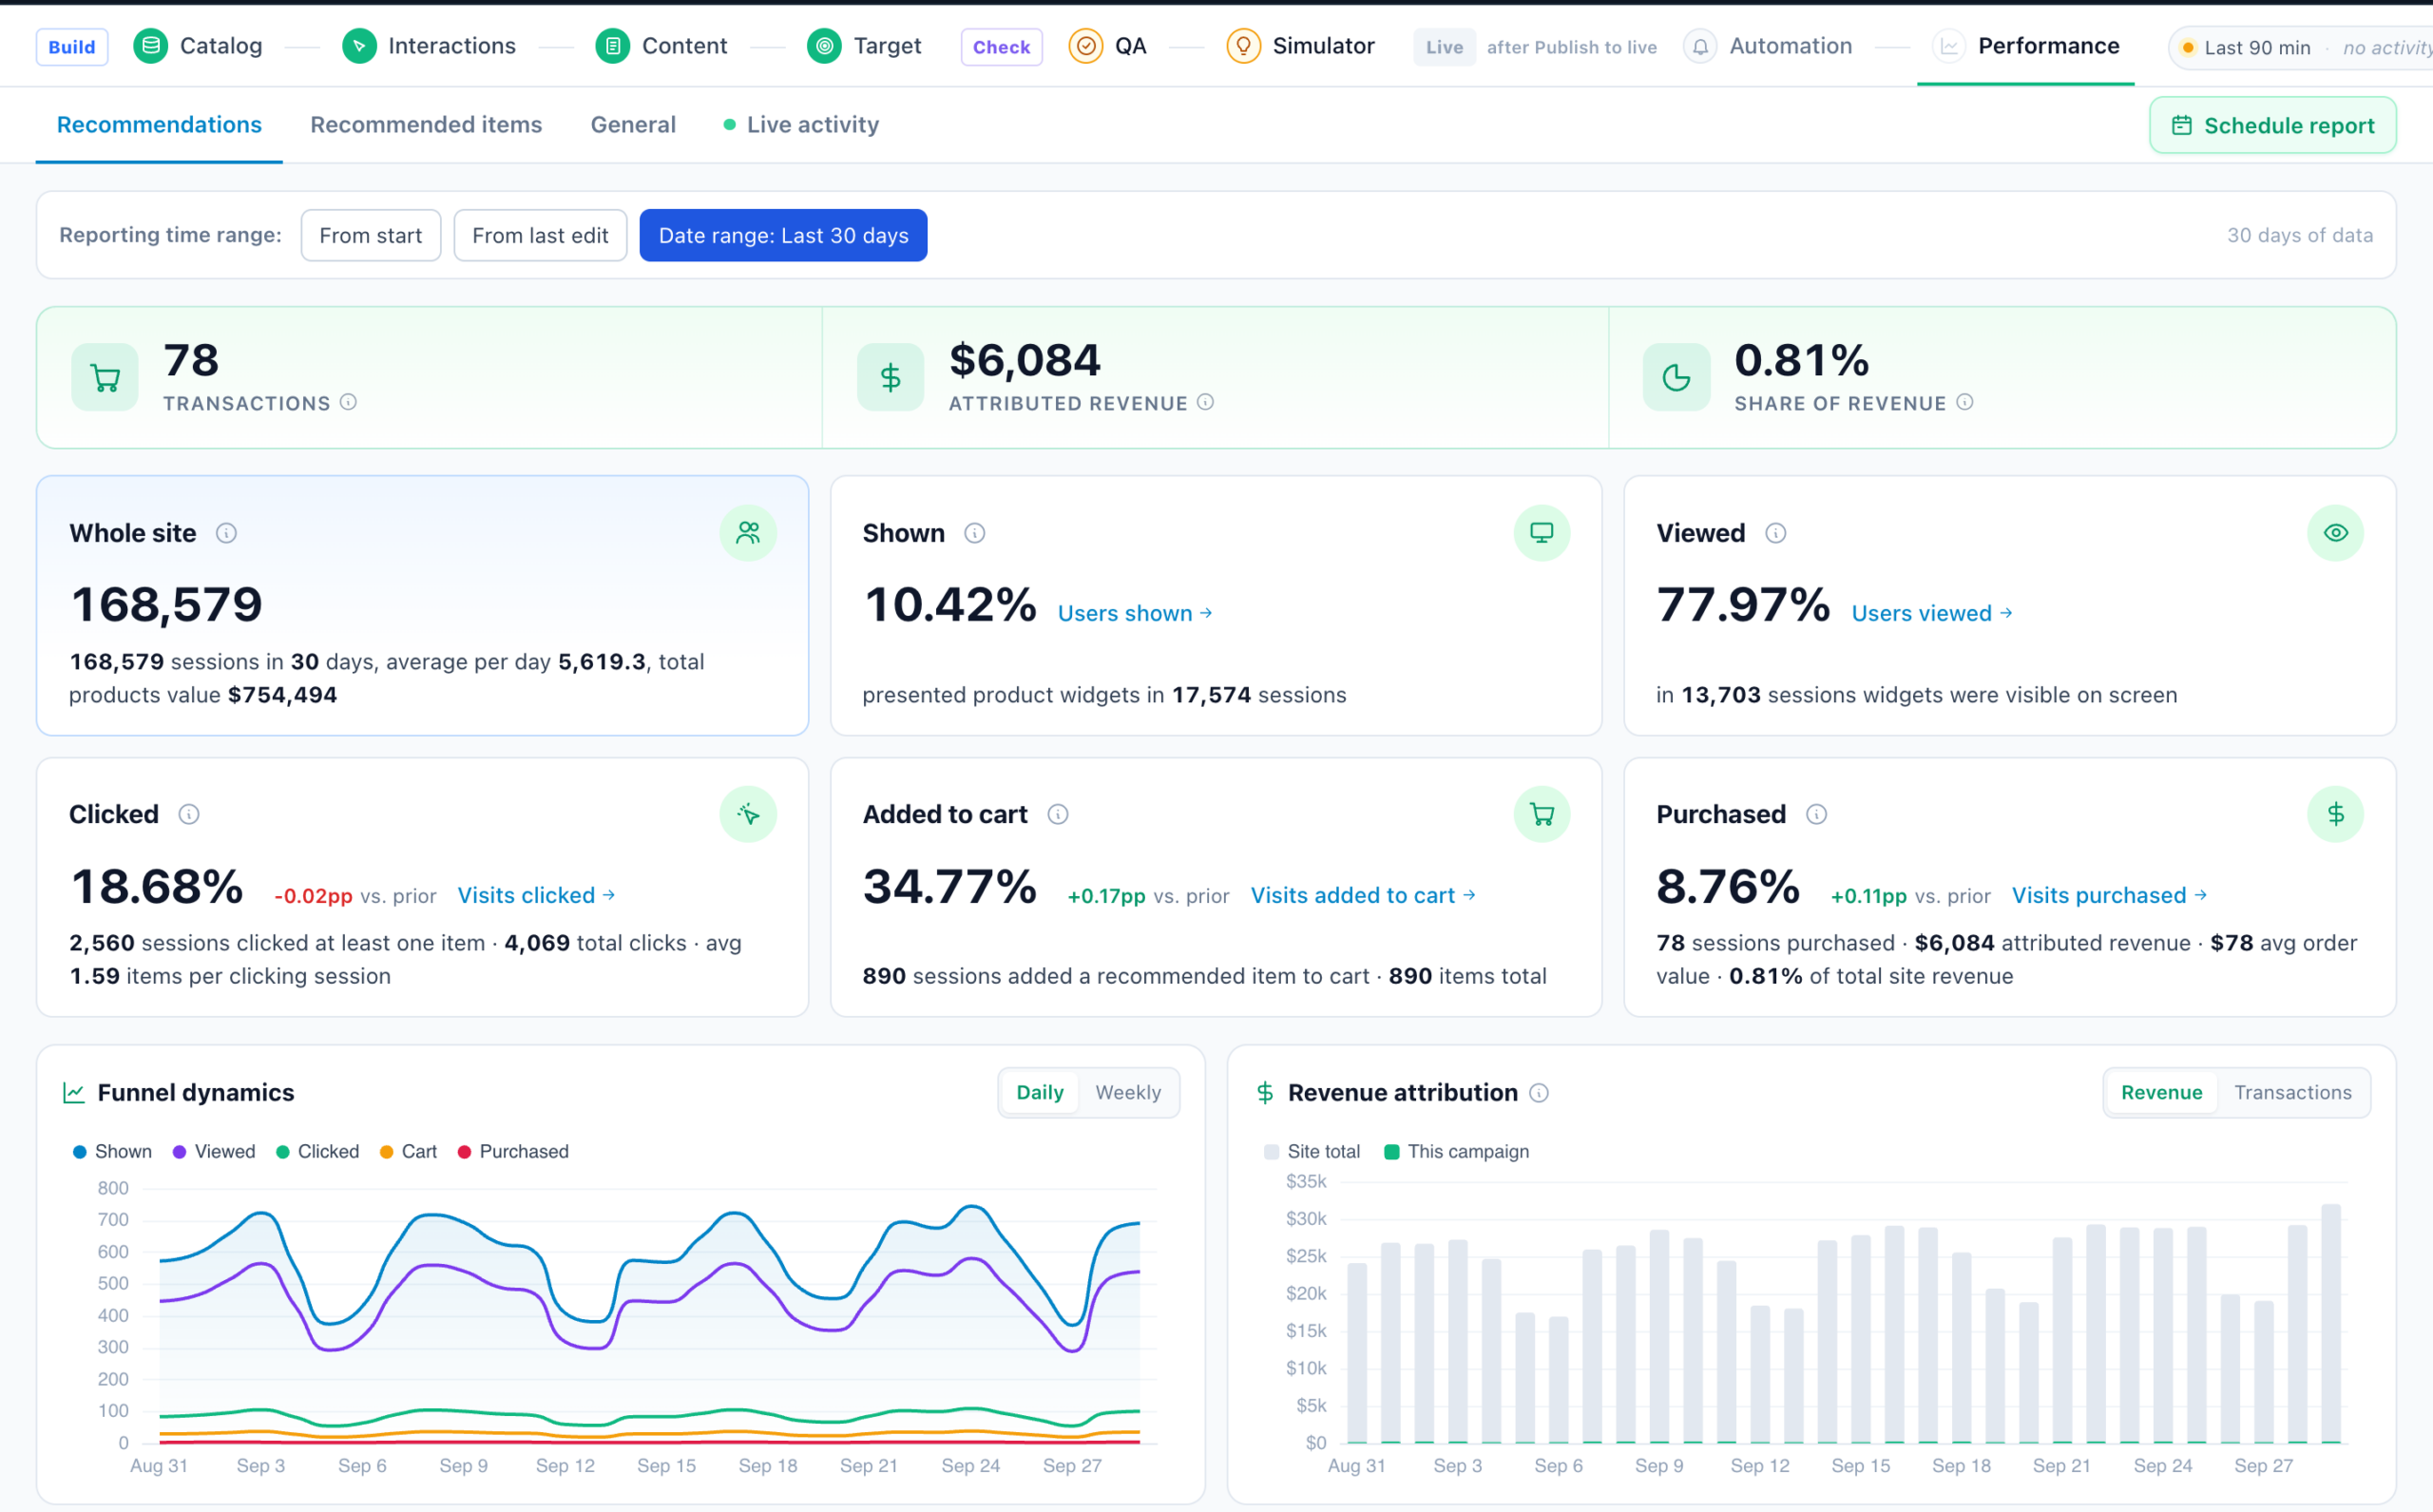
| Card | What it counts | What a low number usually means |
|---|---|---|
| Transactions · Attributed revenue · Share of revenue | Purchases that included an item this widget recommended and the visitor clicked; their value; that value as a share of all product revenue. | |
| Shown | Visits in which the widget was rendered, as a share of all site visits. | The widget is placed on too few pages. |
| Viewed | Visits in which the widget came on screen, as a share of Shown. | The widget sits below the fold. |
| Clicked | Visits that clicked at least one recommended item, as a share of Viewed. | The items are not relevant enough, or the design does not invite a click. |
| Added to cart | Visits that added a clicked item to the cart, as a share of Clicked. | Price, stock, or the product page. |
| Purchased | Visits that bought a clicked item, as a share of Added to cart, with average order value and share of site revenue. | Checkout friction. |
Before trusting a widget, check the data behind it.
- A recommendation campaign’s side panel scores the pipeline live: catalog in place, product views, add-to-cart and purchases arriving (each shown separately), and whether the engine is still collecting. Expedite lets you upload past orders to skip the wait.
- Product Tracking shows each event as receiving, quiet or never received.
- Live visits shows interactions per visitor as they arrive.
Recommended Items
Where: Analytics → Product analytics → Recommended Items, and the Recommended items tab of a recommendation campaign. It shows which items each widget put in front of people, and how each item did.
| Figure | What it counts |
|---|---|
| Times shown | Each time an item card was at least two thirds visible. A widget below the fold that was never scrolled to counts nothing. |
| Clicks | Clicks on an item inside a widget, counted as events. |
| Click rate | Clicks ÷ times shown. Per item it is only shown after 100 times shown, because below that one click reads as a huge rate. |
| Purchases | Purchases within 7 days of interacting with that item in that widget. Purchase events, not revenue, and counted on the day of the purchase. |
| Movement | The later half of the range against the earlier half, for the chosen metric. |
Filters pick out Best performing items (click rate at least 1.25× the average), Underperforming items (at most half the average), and Rising or Falling items (movement of 20% or more either way). This data is kept for 90 days.
Recommendation Sets
Where: Analytics → Product analytics → Recommendation Sets. What the engine learned from real shopping behaviour, per product.
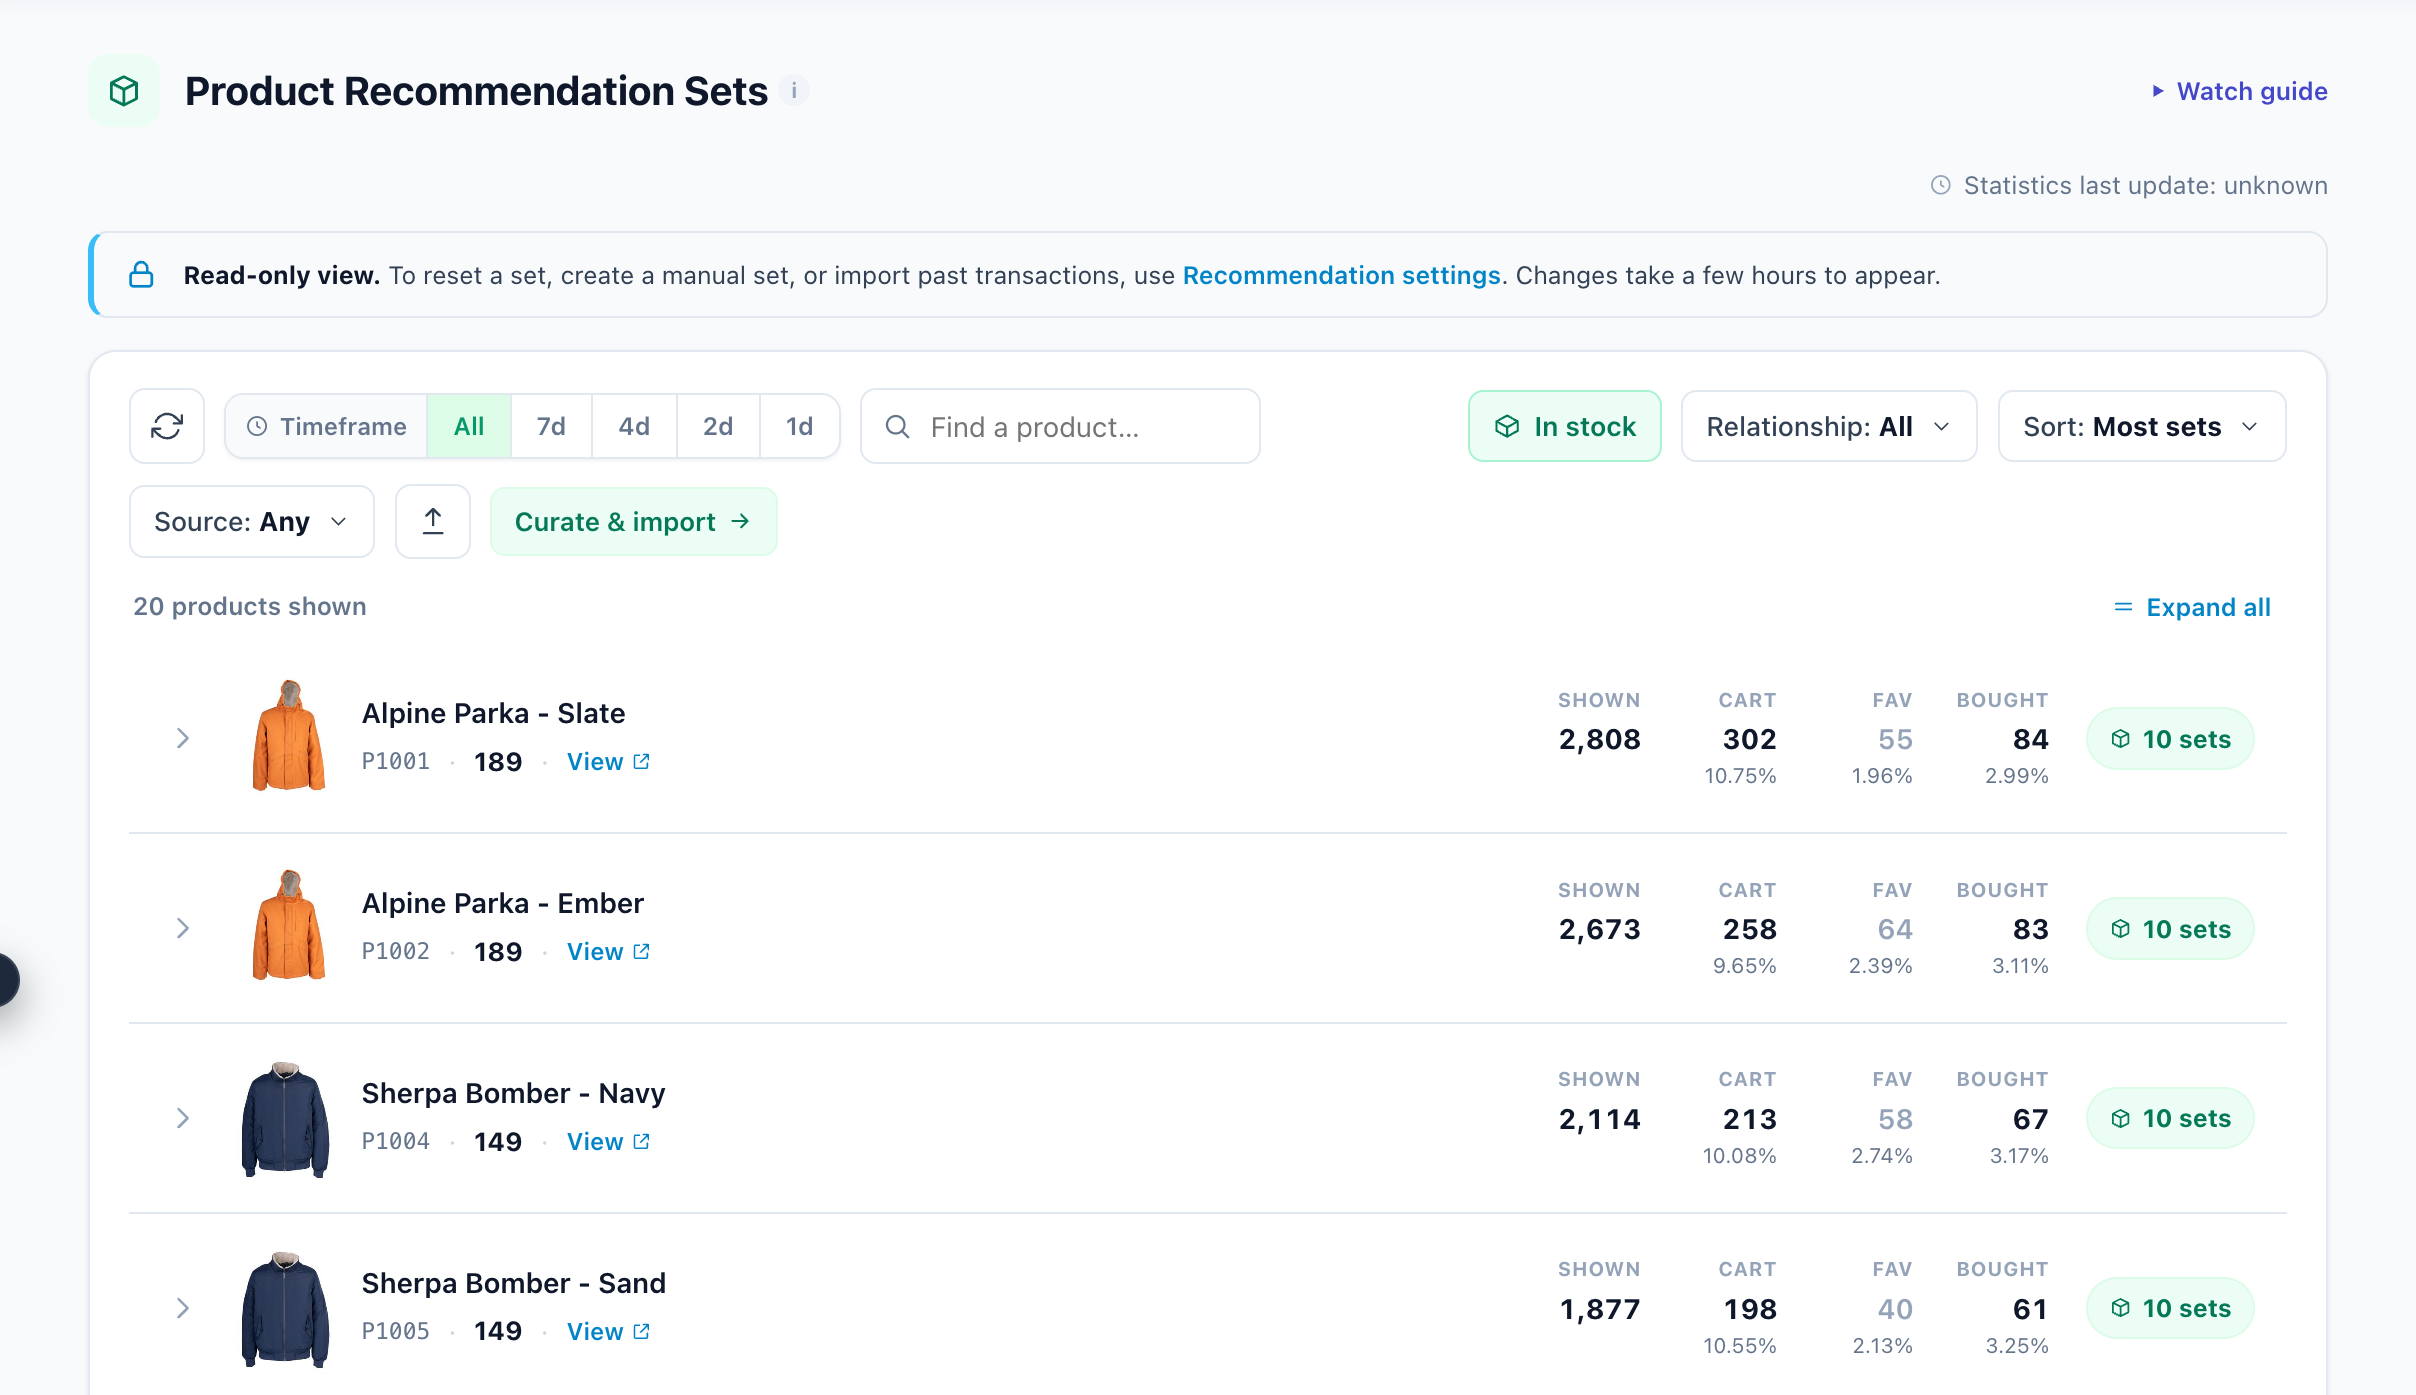
The stages are cumulative: a purchase also counts as a cart. Each set shows the following:
- Strength: how strong the pair is next to the product’s best pair.
- Users: people who interacted with both products.
- Common transactions: orders that included both products.
This screen has its own timeframe (All, 7, 4, 2 or 1 days). It ignores the Reporting range.
Trending Report
Where: Analytics → Product analytics → Trending Report.
- It compares a recent window (the last 1, 2, 4 or 7 days) against the 7-day or all-time average: Δ% = (recent − baseline) ÷ baseline.
- Metrics for products: conversion (purchases ÷ views), views per day, add-to-cart rate, cart-to-purchase rate and purchases per day.
- ▲ and ▼ mark movement; → means flat, within ±3%.
- Feed attention lists out-of-stock items that people still viewed or bought.
- These figures are site-wide, not limited to widgets.
Content recommendations
For articles the funnel has no cart stage:
- Engaged: visits that clicked a recommended article, as a share of Viewed. A widget below the fold was never a chance to engage.
- Goal rate: of those that clicked, the share that completed your content goal.
Analytics → Content analytics has the same Recommended Items, Recommendation Sets and Trending screens for articles.
A/B and multivariate tests
Where: Analytics → A/B testing → A/B tests, or the A/B testing tab of the campaign’s Performance step. Both show the same report.
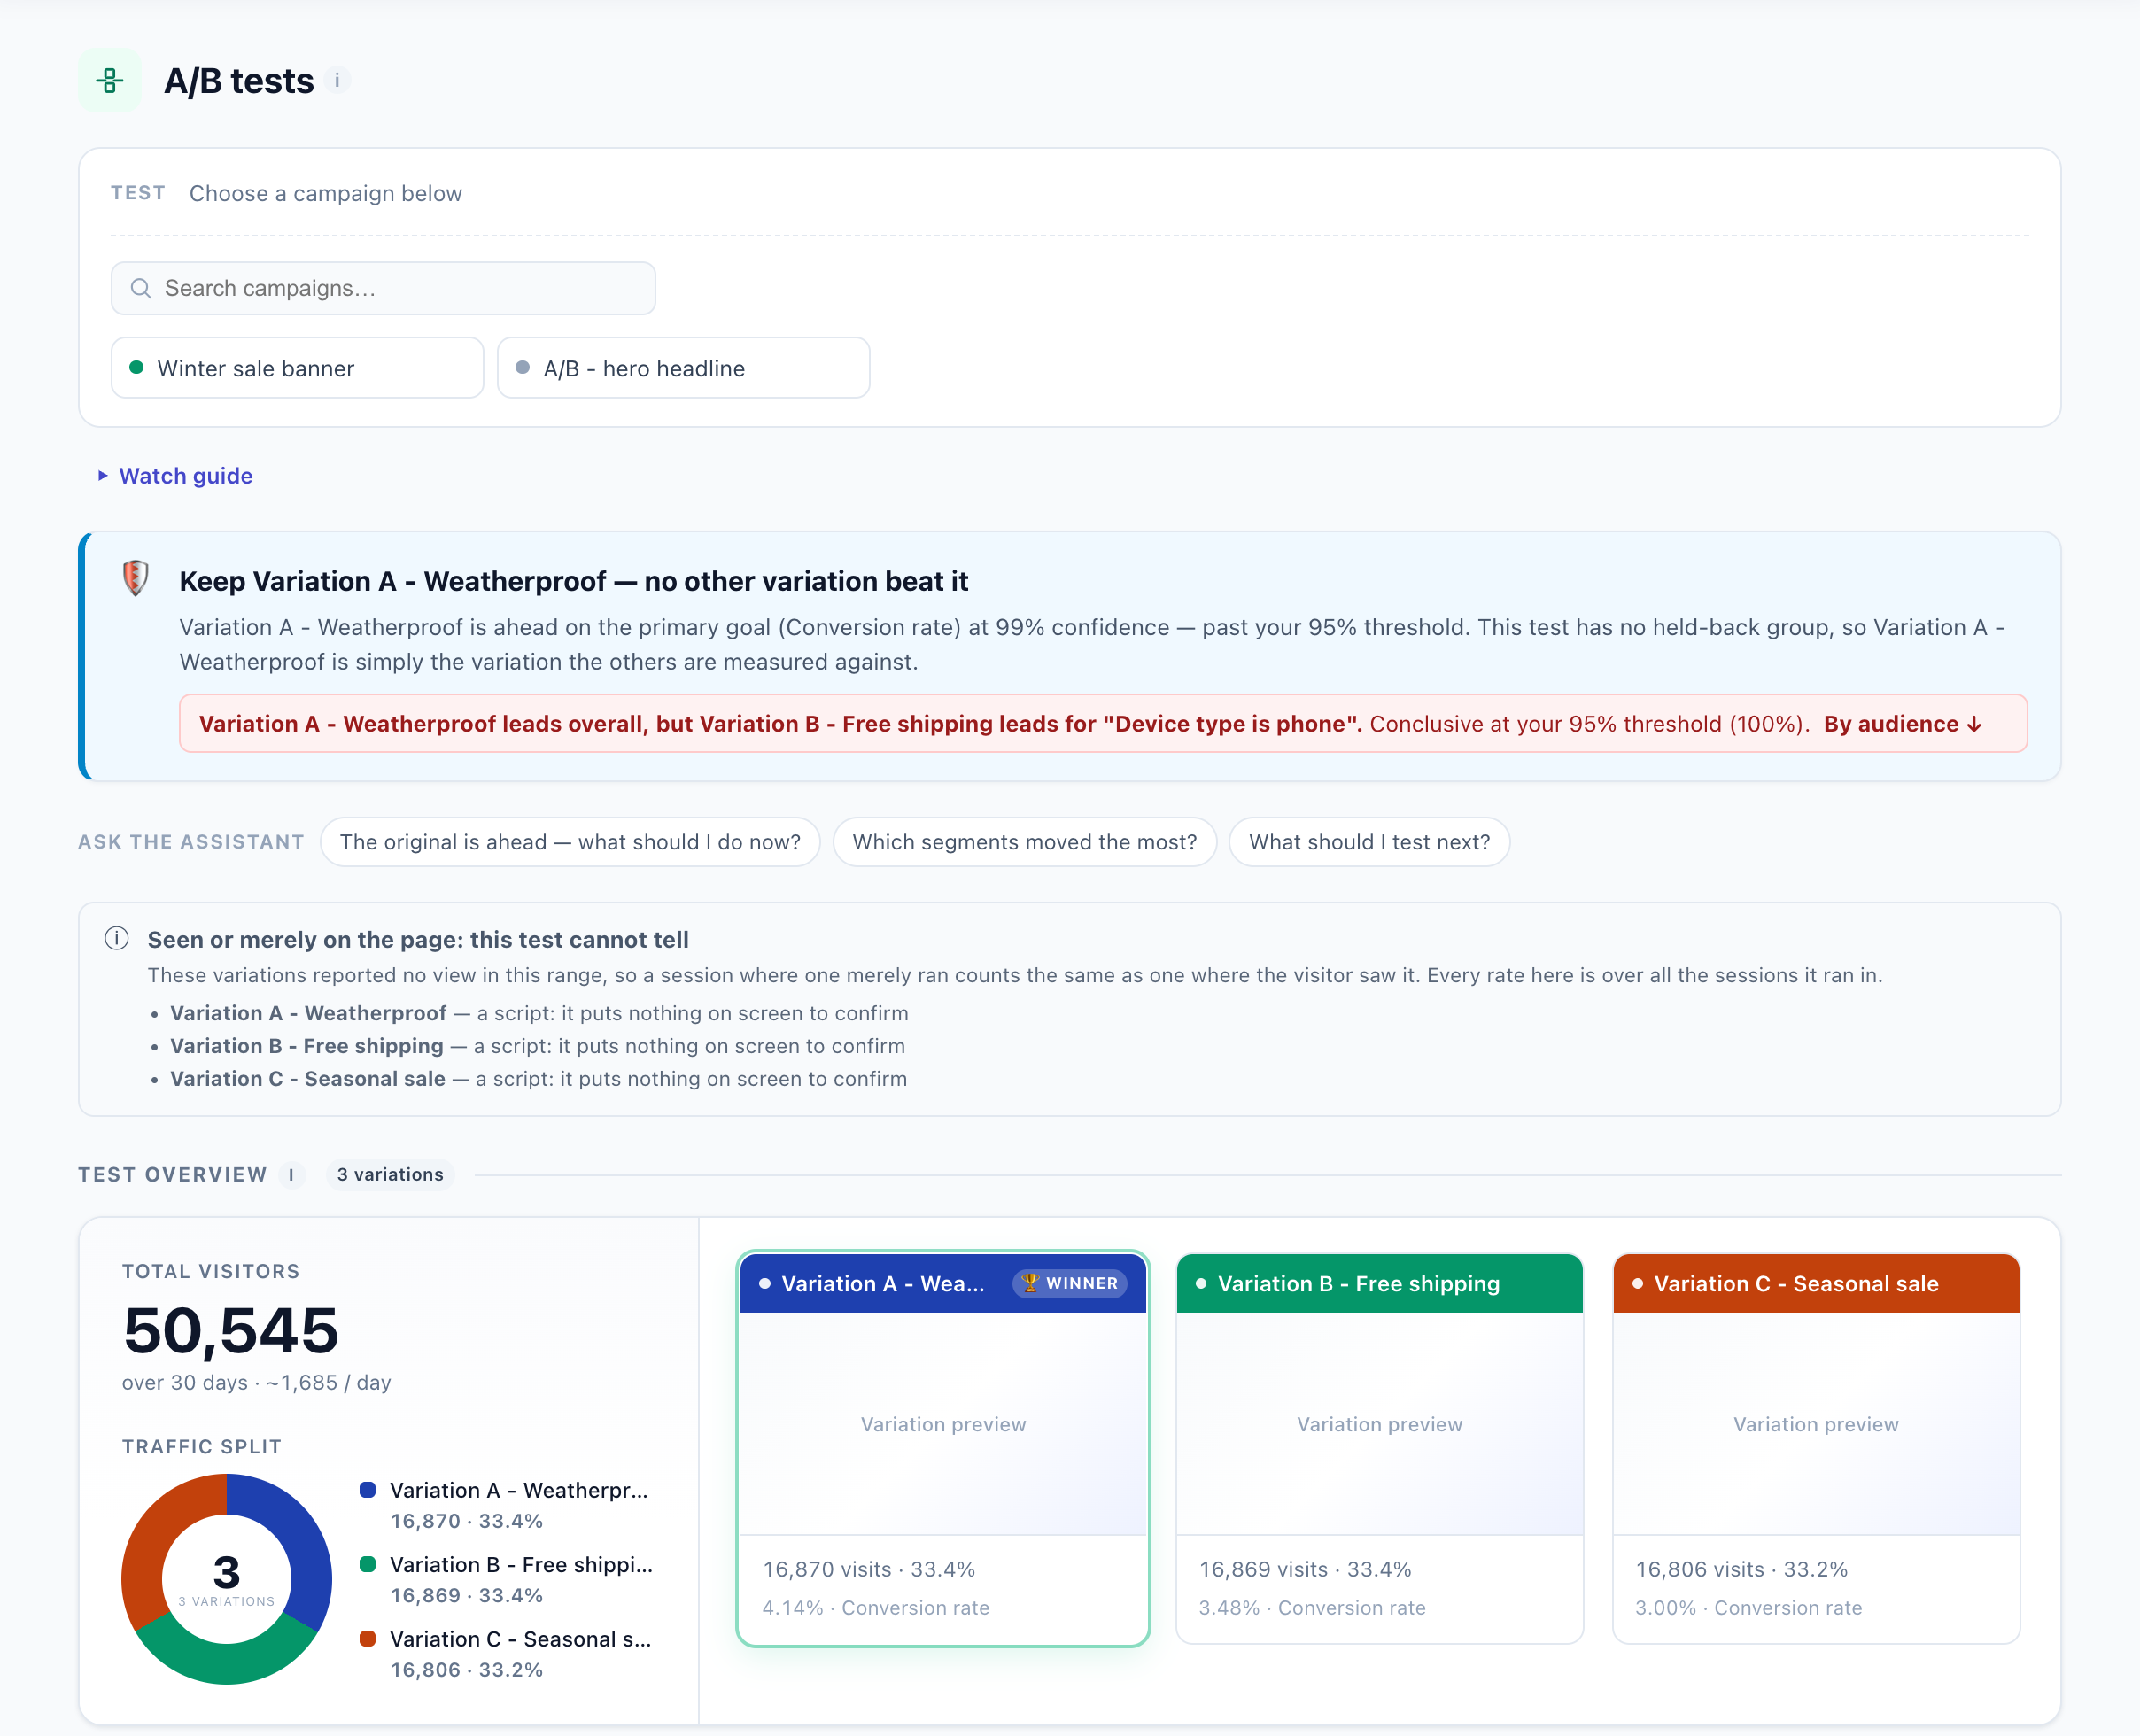
What decides the test. The goal the test names. With no goal, purchases, if any variation has one. Otherwise the conversion rate (any goal). Purchases come before “any goal” because searches and clicks can outnumber sales fifty to one and swamp the result.
| Verdict | What it means |
|---|---|
| Promote variation as the winner | It leads on the deciding metric at or above your confidence threshold, and by at least your minimum improvement if you set one. |
| Keep the original: no variation beat the baseline | The original (or held-back group) is ahead with enough confidence. |
| Keep variation: no other variation beat it | The test has no held-back group, and the first variation, which the others are measured against, stays ahead. |
| Keep running: no conclusive winner yet | The leader has not reached your threshold. Let the test gather more data. |
| Keep running: nothing has reached the primary goal yet | No visit on any variation has reached the deciding goal. If visitors are doing it on the site, check that the goal fires. |
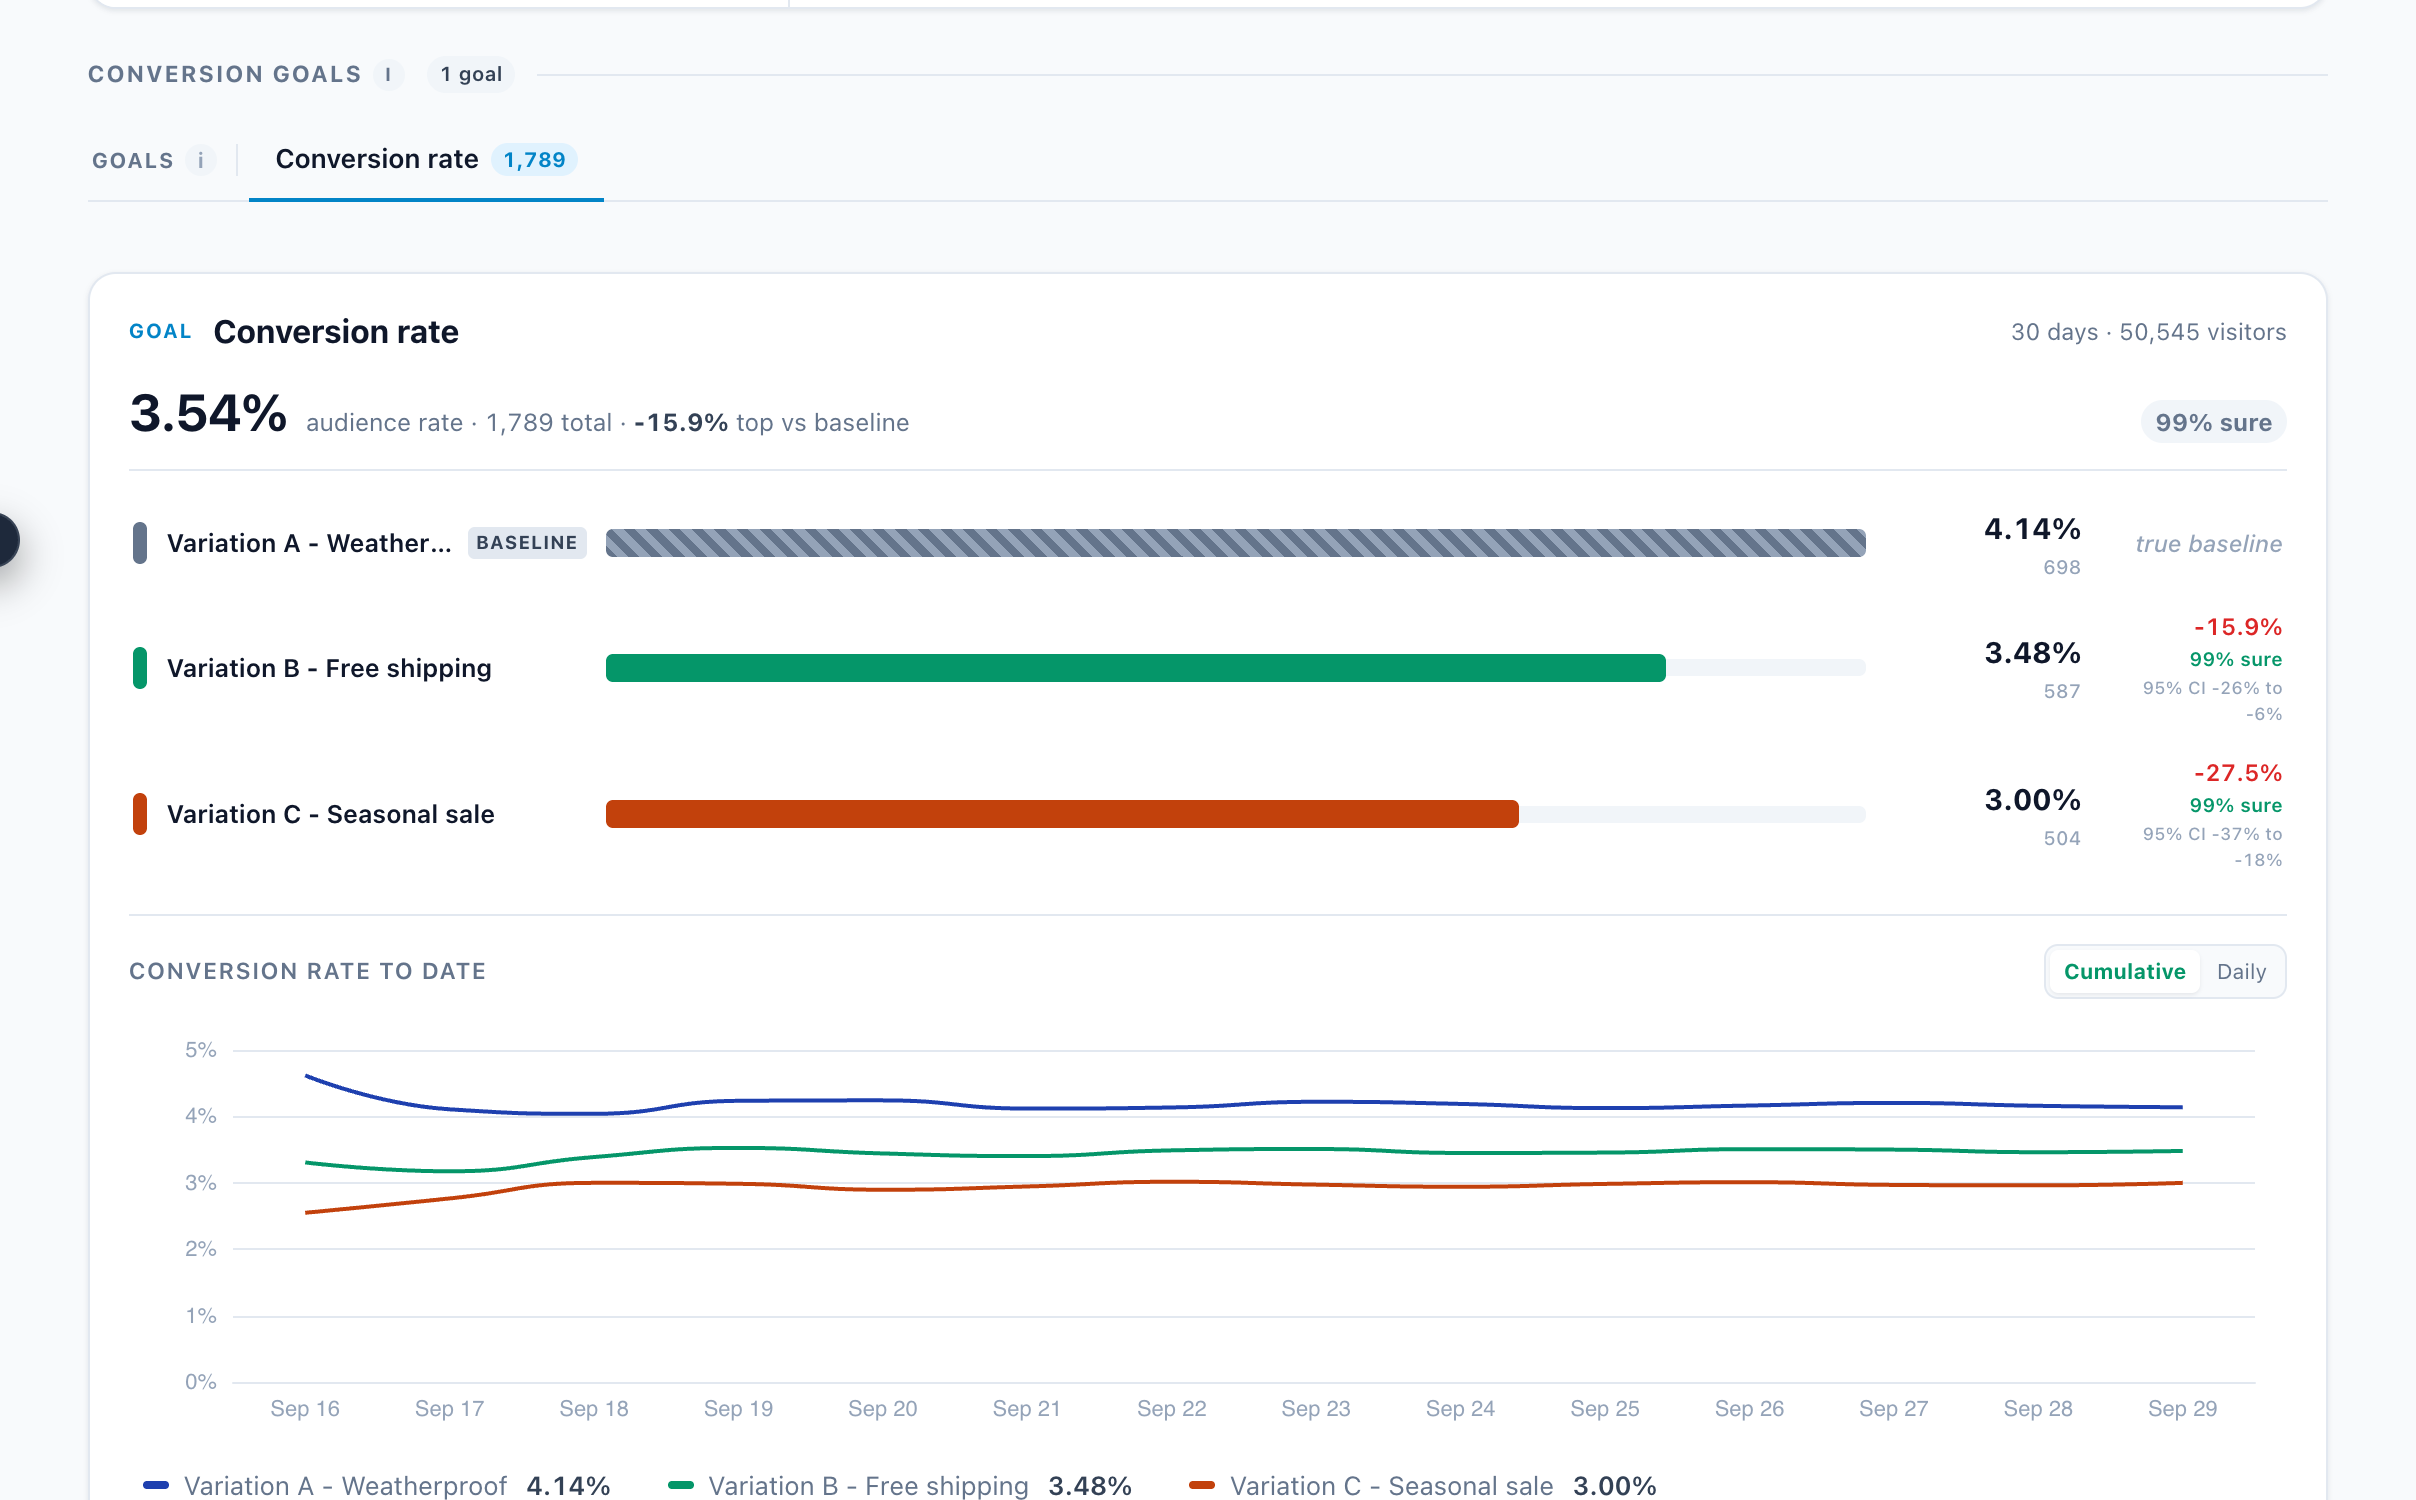
- Visits are the visits a variation ran in. Conversions are visits that reached the deciding goal or bought.
- Lift = (variation rate − baseline rate) ÷ baseline rate.
- % sure is the confidence that the difference is real. It comes from a two-proportion test, rounded down, so it never overstates. The winner needs your campaign’s threshold: new campaigns use 98%, and 95% applies when none is set. Green means the threshold is reached; amber means the result is within 5% of it.
- The 95% CI is the range the true lift most likely falls in. A range that crosses zero is not a result yet.
- These variations were not live over the same days means traffic stopped for one variation for a while, for example after a split was edited mid-test. Only the days every variation ran make a fair comparison.
- Delivery issue means a variation was viewed in fewer than 97% of the times it was sent.
- Seen or merely on the page appears for variations that cannot report a view, such as scripts and redirects. Their rates are over every visit they ran in.
- Decision criteria blends several goals into one ranking, weighted by how much each one matters to you.
- By discovered audience shows where a different variation wins for part of your traffic. It is covered below.
The automatic winner pick (Goal & auto-pick on the Content step, with Cautious, Balanced and Fast presets) is stricter than the report:
- every variation needs its minimum number of visits;
- the test must have run its minimum number of days;
- every goal the test names must agree on the same winner.
So the report can recommend Promote before the automatic pick acts.
Multivariate tests (Analytics → A/B testing → Multivariate tests):
- Every combination compares each combination with the one where every group shows its control. Lift is in percentage points, and confidence uses a fixed 95%.
- The best tag marks the highest rate without a significance test.
- Main effect of each group shows what each option adds on its own.
Audience Discovery
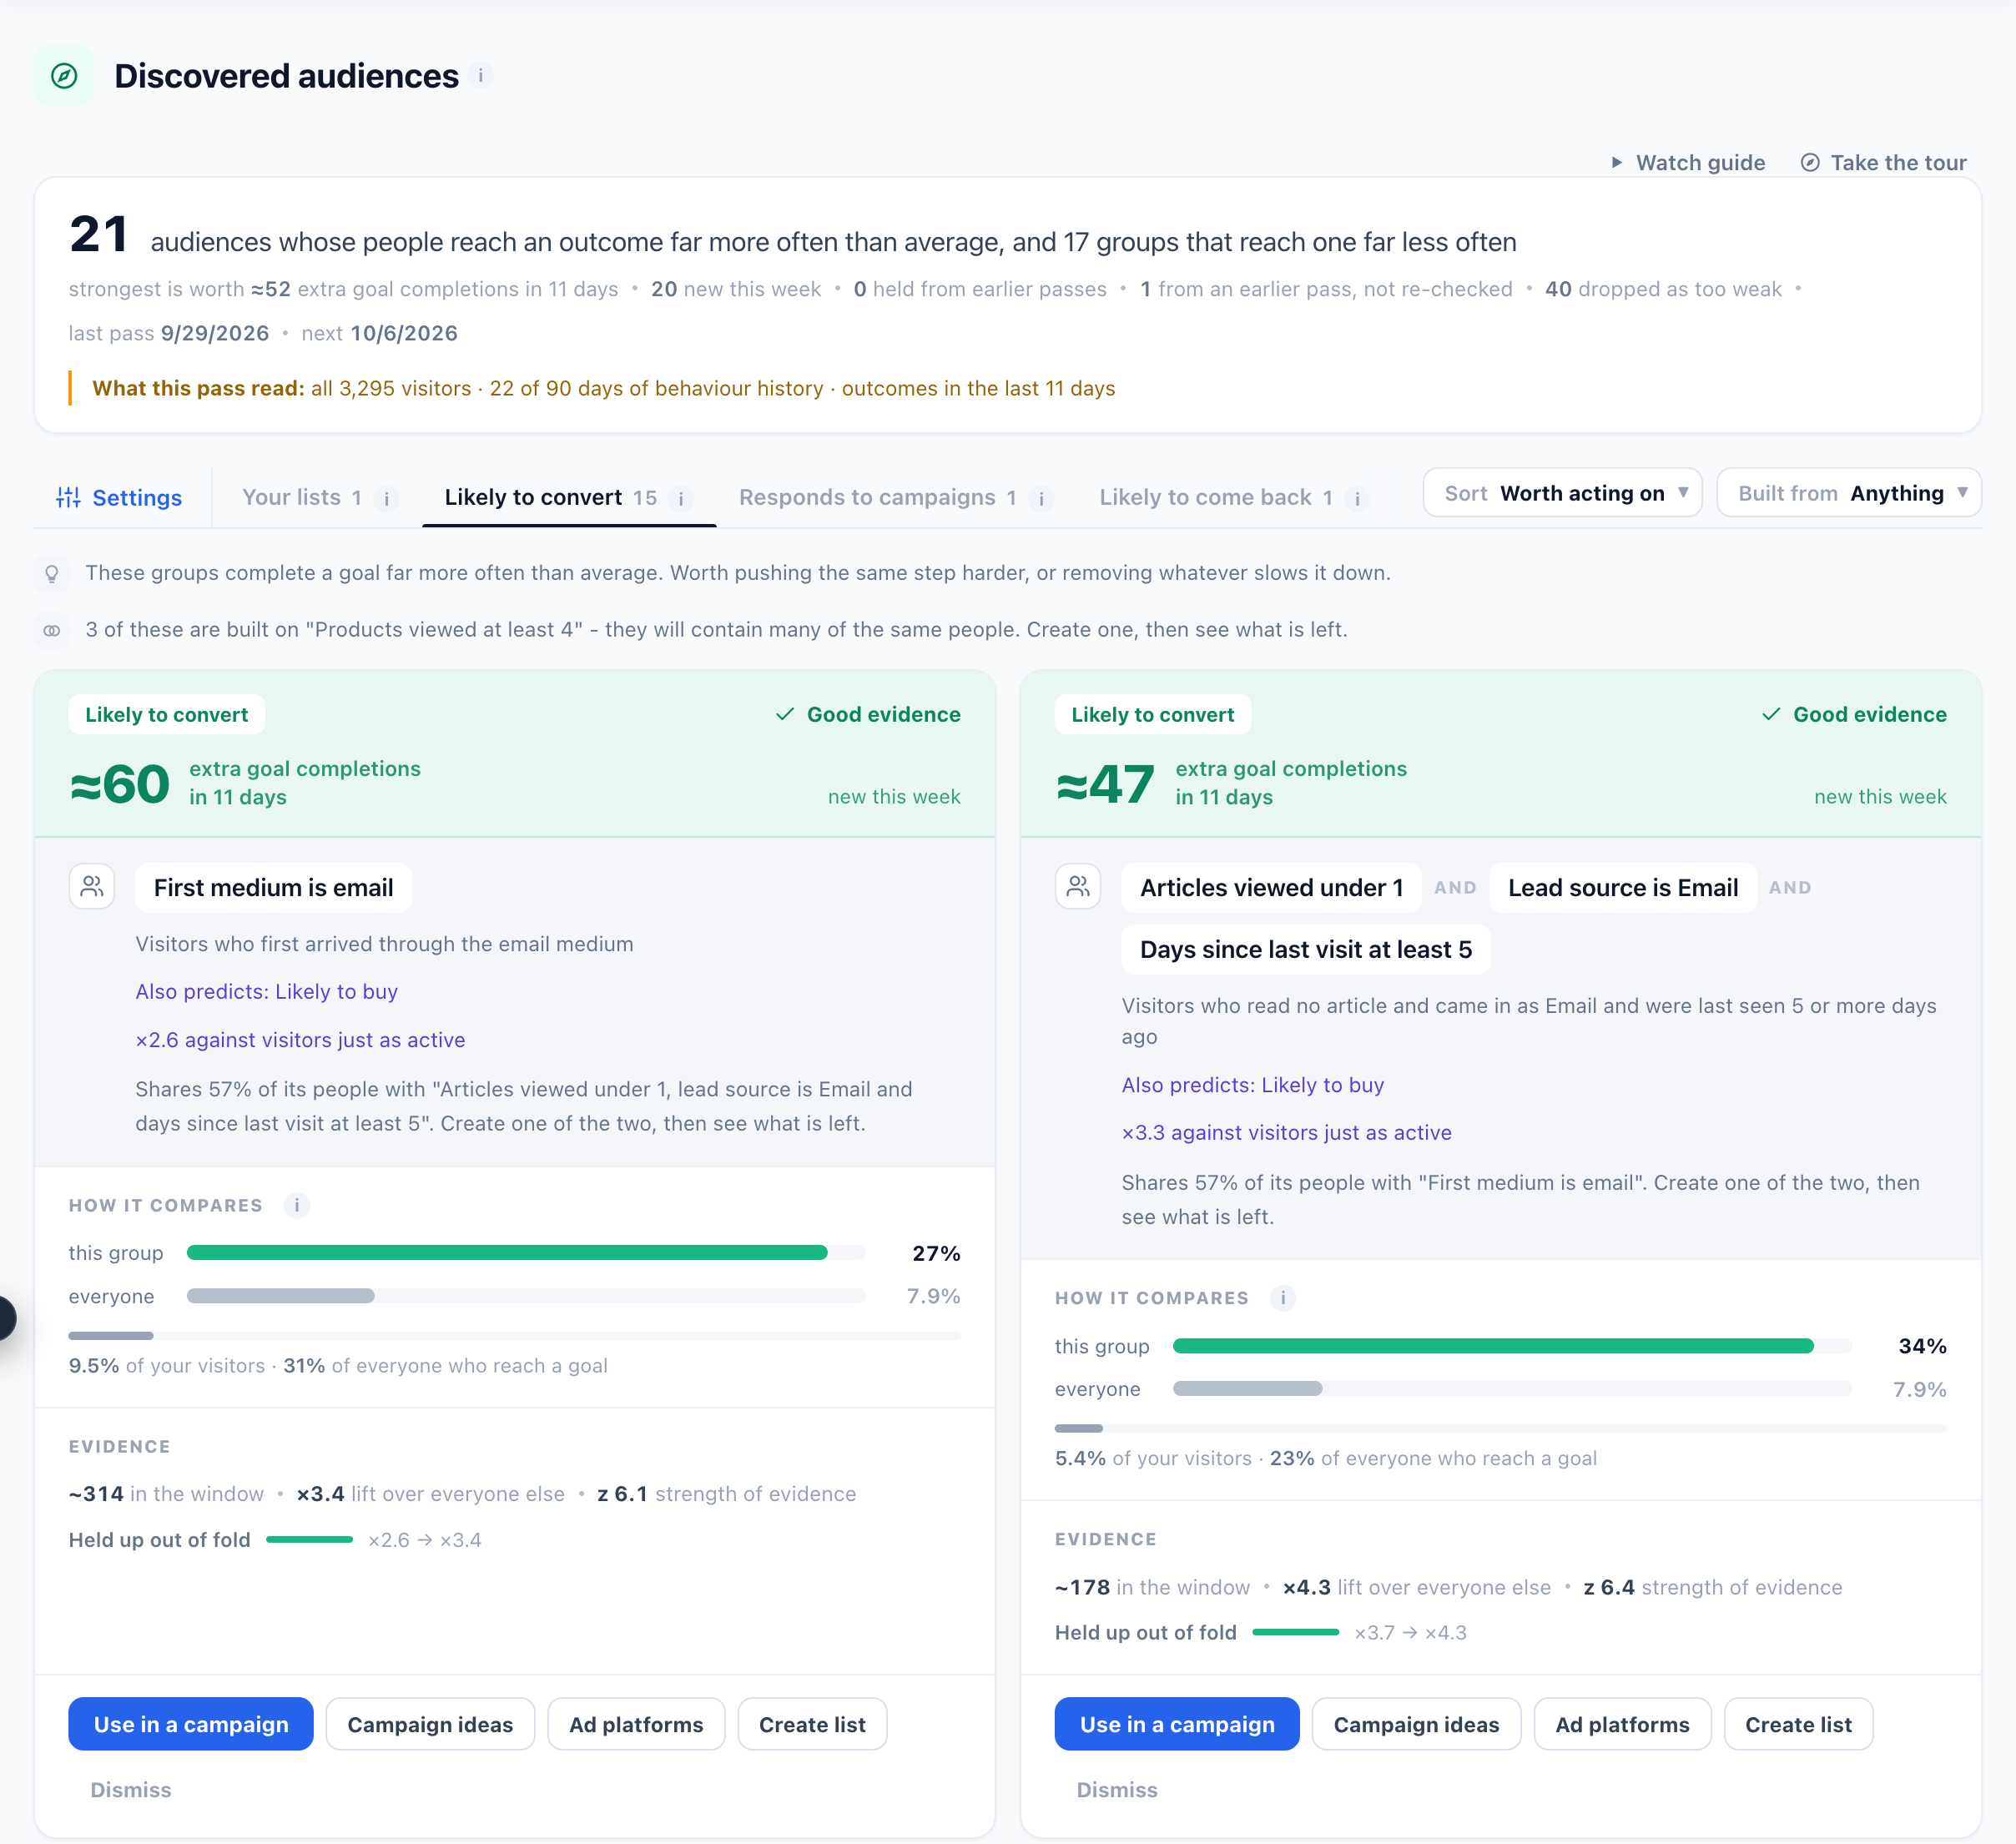
Where: Audiences → Discovered audiences. Once a week Personyze looks for short rules that pick out visitors who reach an outcome far more often, or far less often, than average. Each rule is measured on a quarter of your visitors that it was not fitted on. See Audience Discovery for the whole feature.
| On a card | What it means |
|---|---|
| ≈N extra … in D days | The group’s size × (its rate − the average rate): how many more outcomes it produced than an average group of that size. |
| How it compares | The share of this group that reaches the outcome, against the share of all visitors. |
| ~n in the window | Visitors in the group over the outcome window, scaled from the sample to all visitors. Not a live count. |
| ×lift | How many times more often than everyone else the group reaches the outcome. |
| z (strength of evidence) | How many standard errors the group sits above average: 2 is weak, 3 is likely real, 5 is beyond doubt. |
| Held up out of fold | The lift while the rule was being found, against the lift on visitors it had never seen. A rule that shrinks a lot was partly fitting noise. |
| Strong / Good / Weak evidence | Strong: z of 5 or more, found in at least two weekly passes. Good: z of 3 or more. Weak: below 3. |
A rule is only shown with at least 30 visitors, a z of 2 or more, and a lift of at least 1.5× (or at most 1 ÷ 1.5 for the lowest performers).
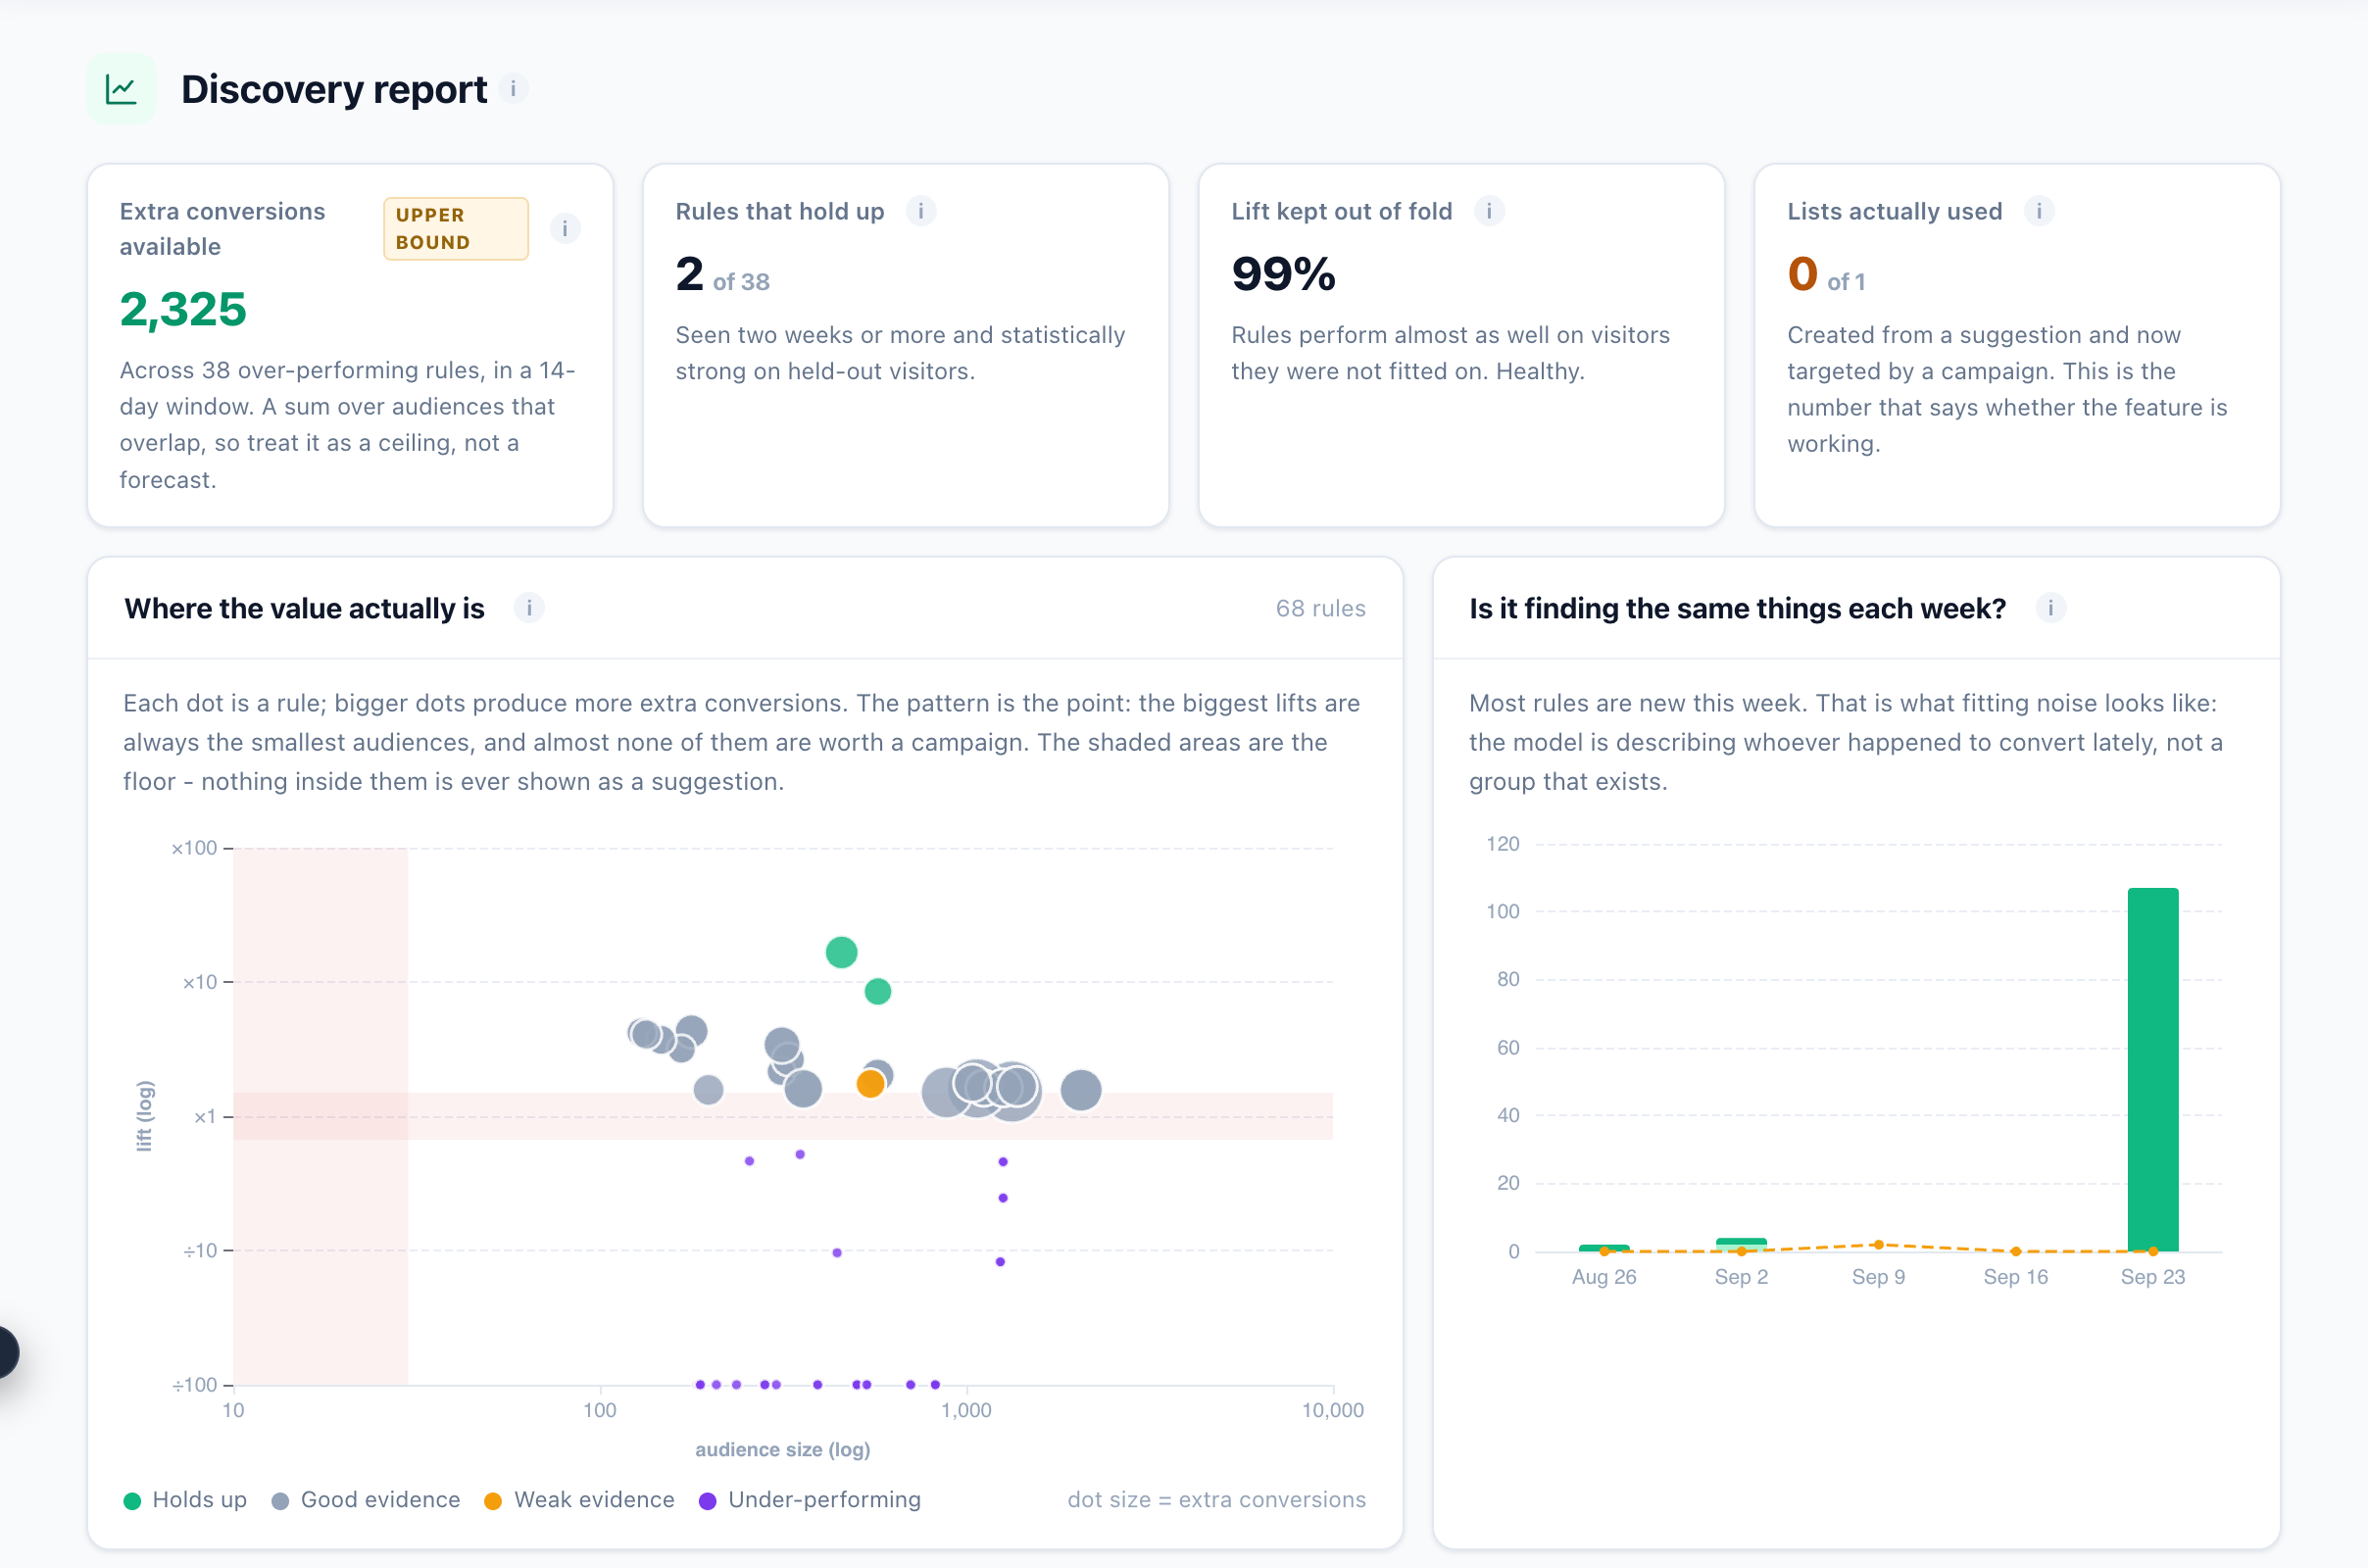
Audiences → Discovery report has four headline tiles:
- Extra conversions available is an upper bound. One buyer can sit in several audiences, so it is a ceiling, never a forecast.
- Rules that hold up counts the strong-evidence rules.
- Lift kept out of fold is healthy above 80%. Below 60%, the mining is describing noise.
- Lists actually used counts lists a campaign targets today.
Is it finding the same things each week? should show mostly held bars. A week of mostly new rules is what fitting noise looks like.
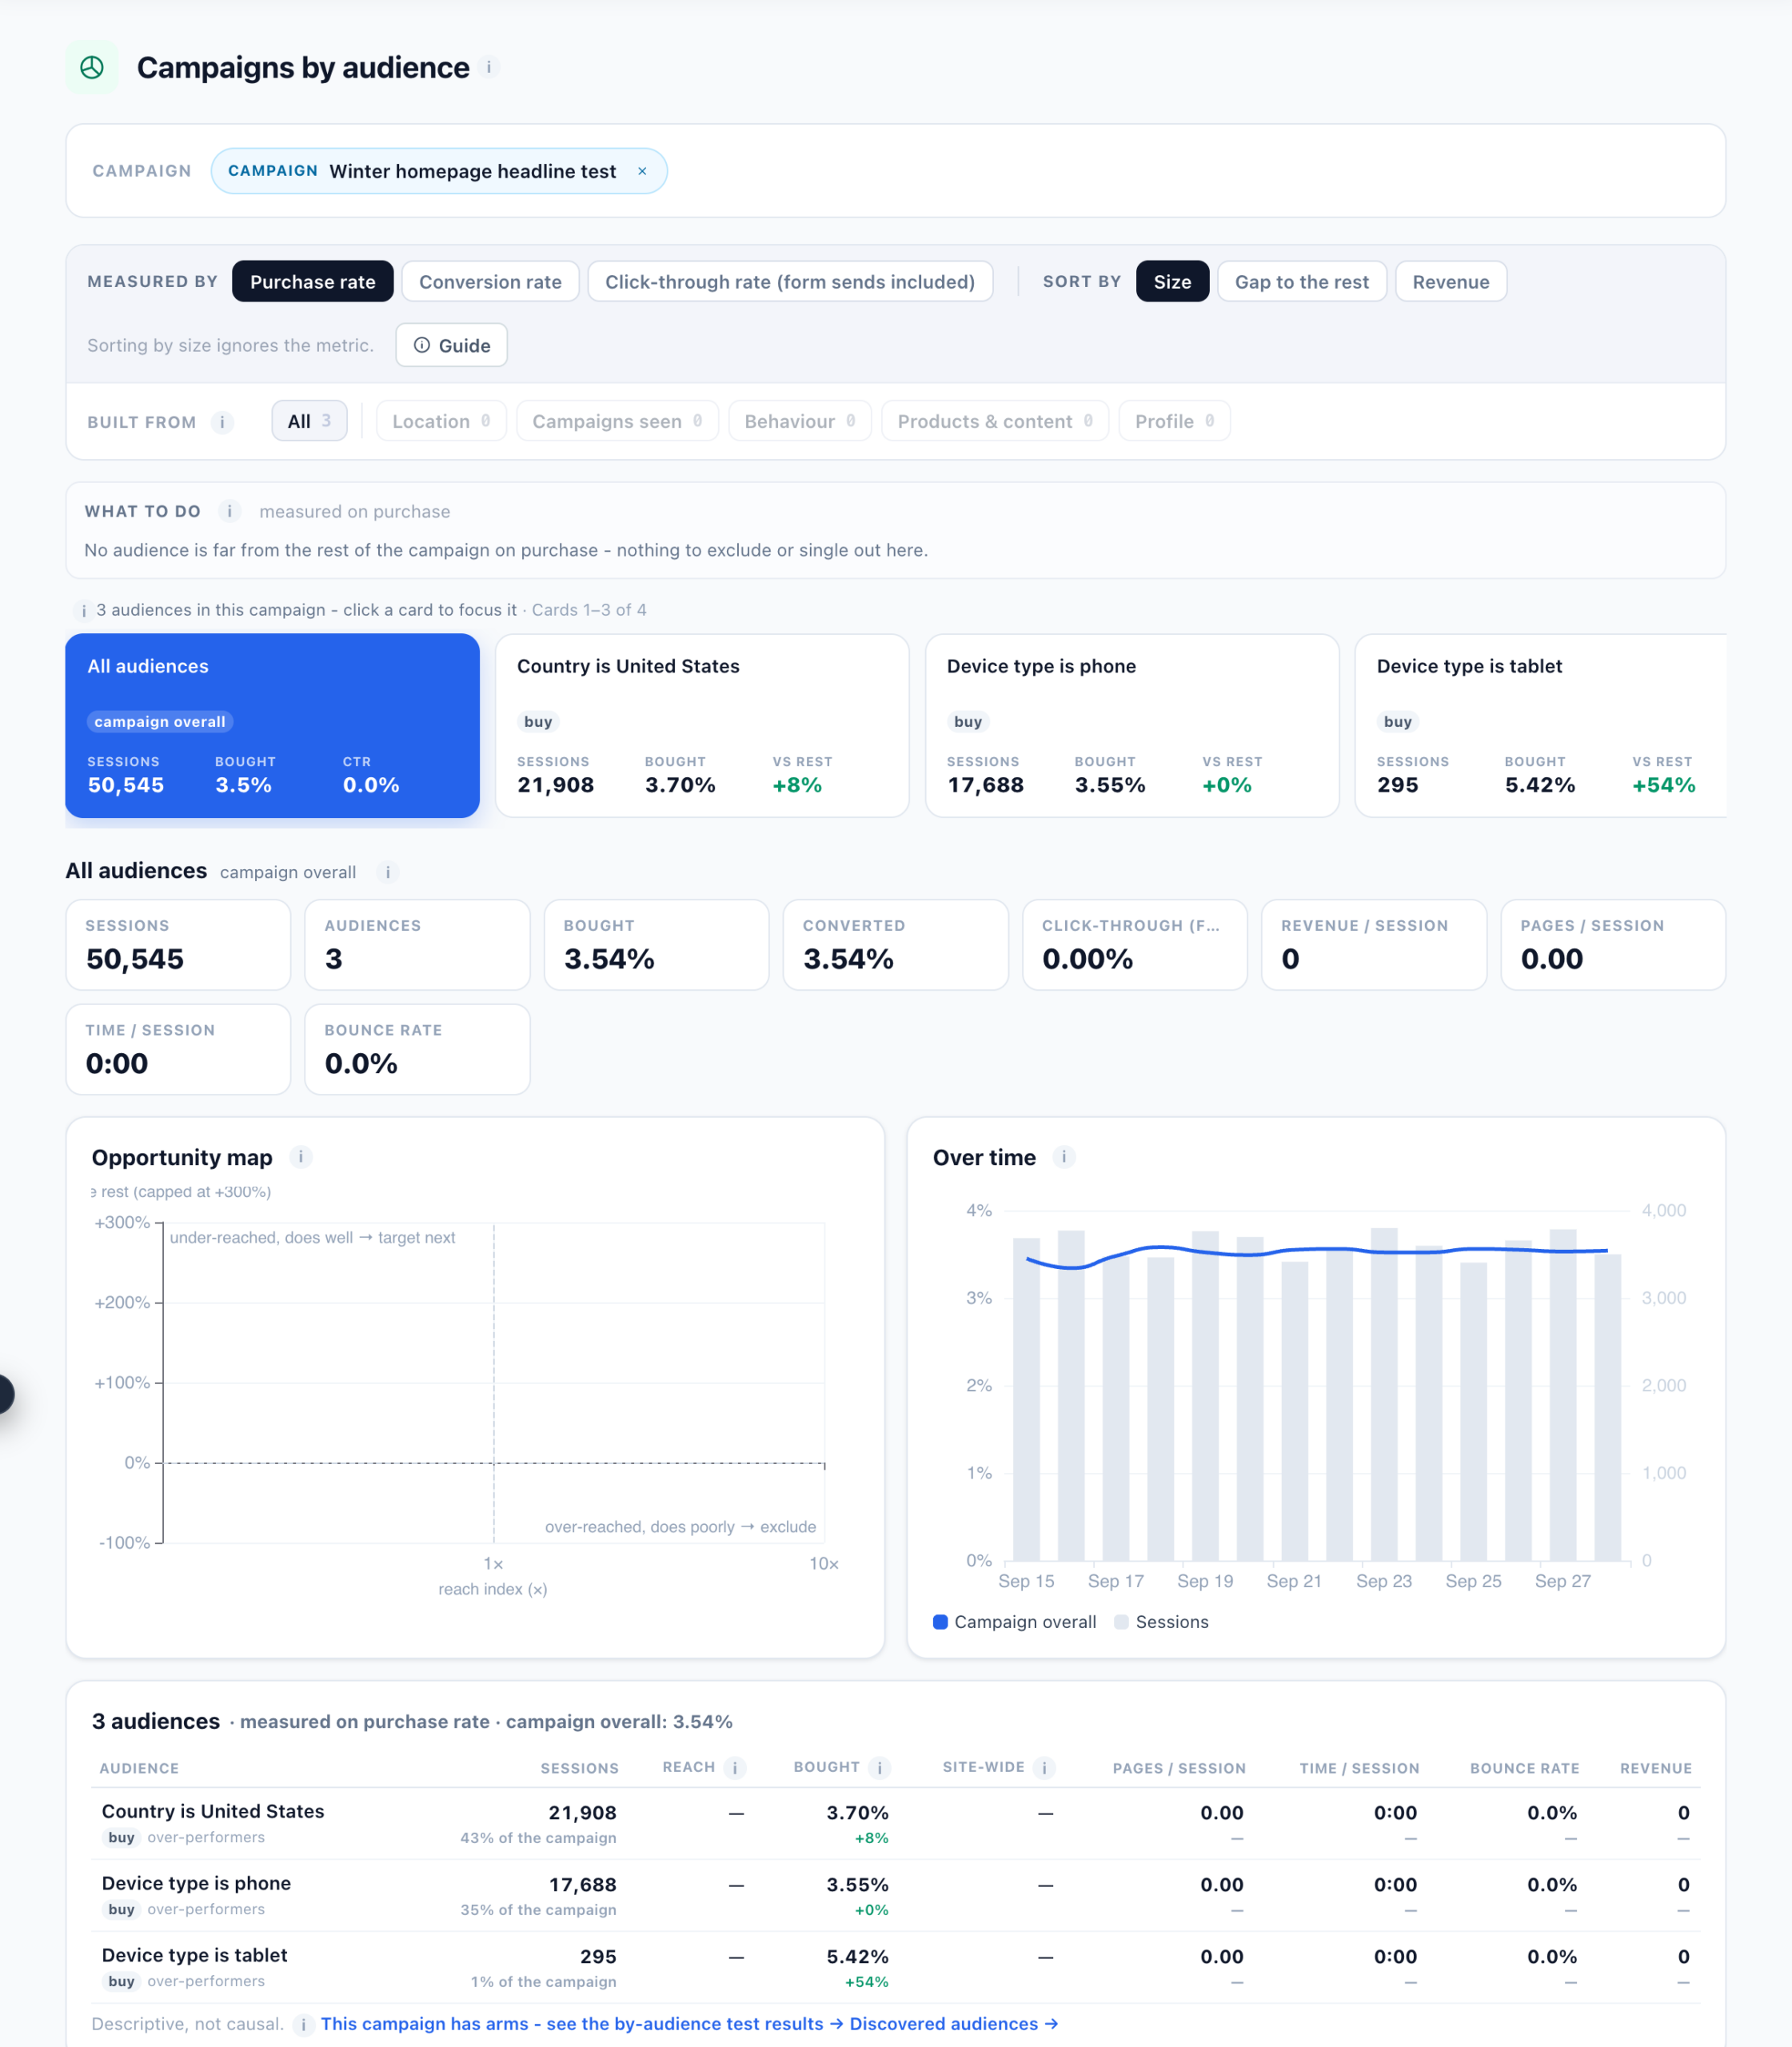
Campaigns by audience compares each audience with the rest of the campaign, not with the campaign overall.
- Reach index is the audience’s share of the campaign’s visits ÷ its share of all site visits. Above 1.2× the campaign over-reaches the group; below 0.8× it under-reaches it.
- What to do only names an audience with at least 100 visits, a z of 2.5 or more and a gap of at least 10%.
- It is descriptive, not causal: it shows who converts here, not what the campaign caused.
A/B tests by audience slices a test by audience. A Clear winner needs all four of these:
- it leads a different variation than the overall winner;
- it stays conclusive after correcting for how many audiences were compared;
- it is ahead in both halves of the days;
- it has at least 200 visits per variation and 10 conversions.
See Apply A/B Test Winners to Their Audiences.
Live visits and Campaign activity
Where: Live visits in the main menu, and Analytics → Campaign activity.
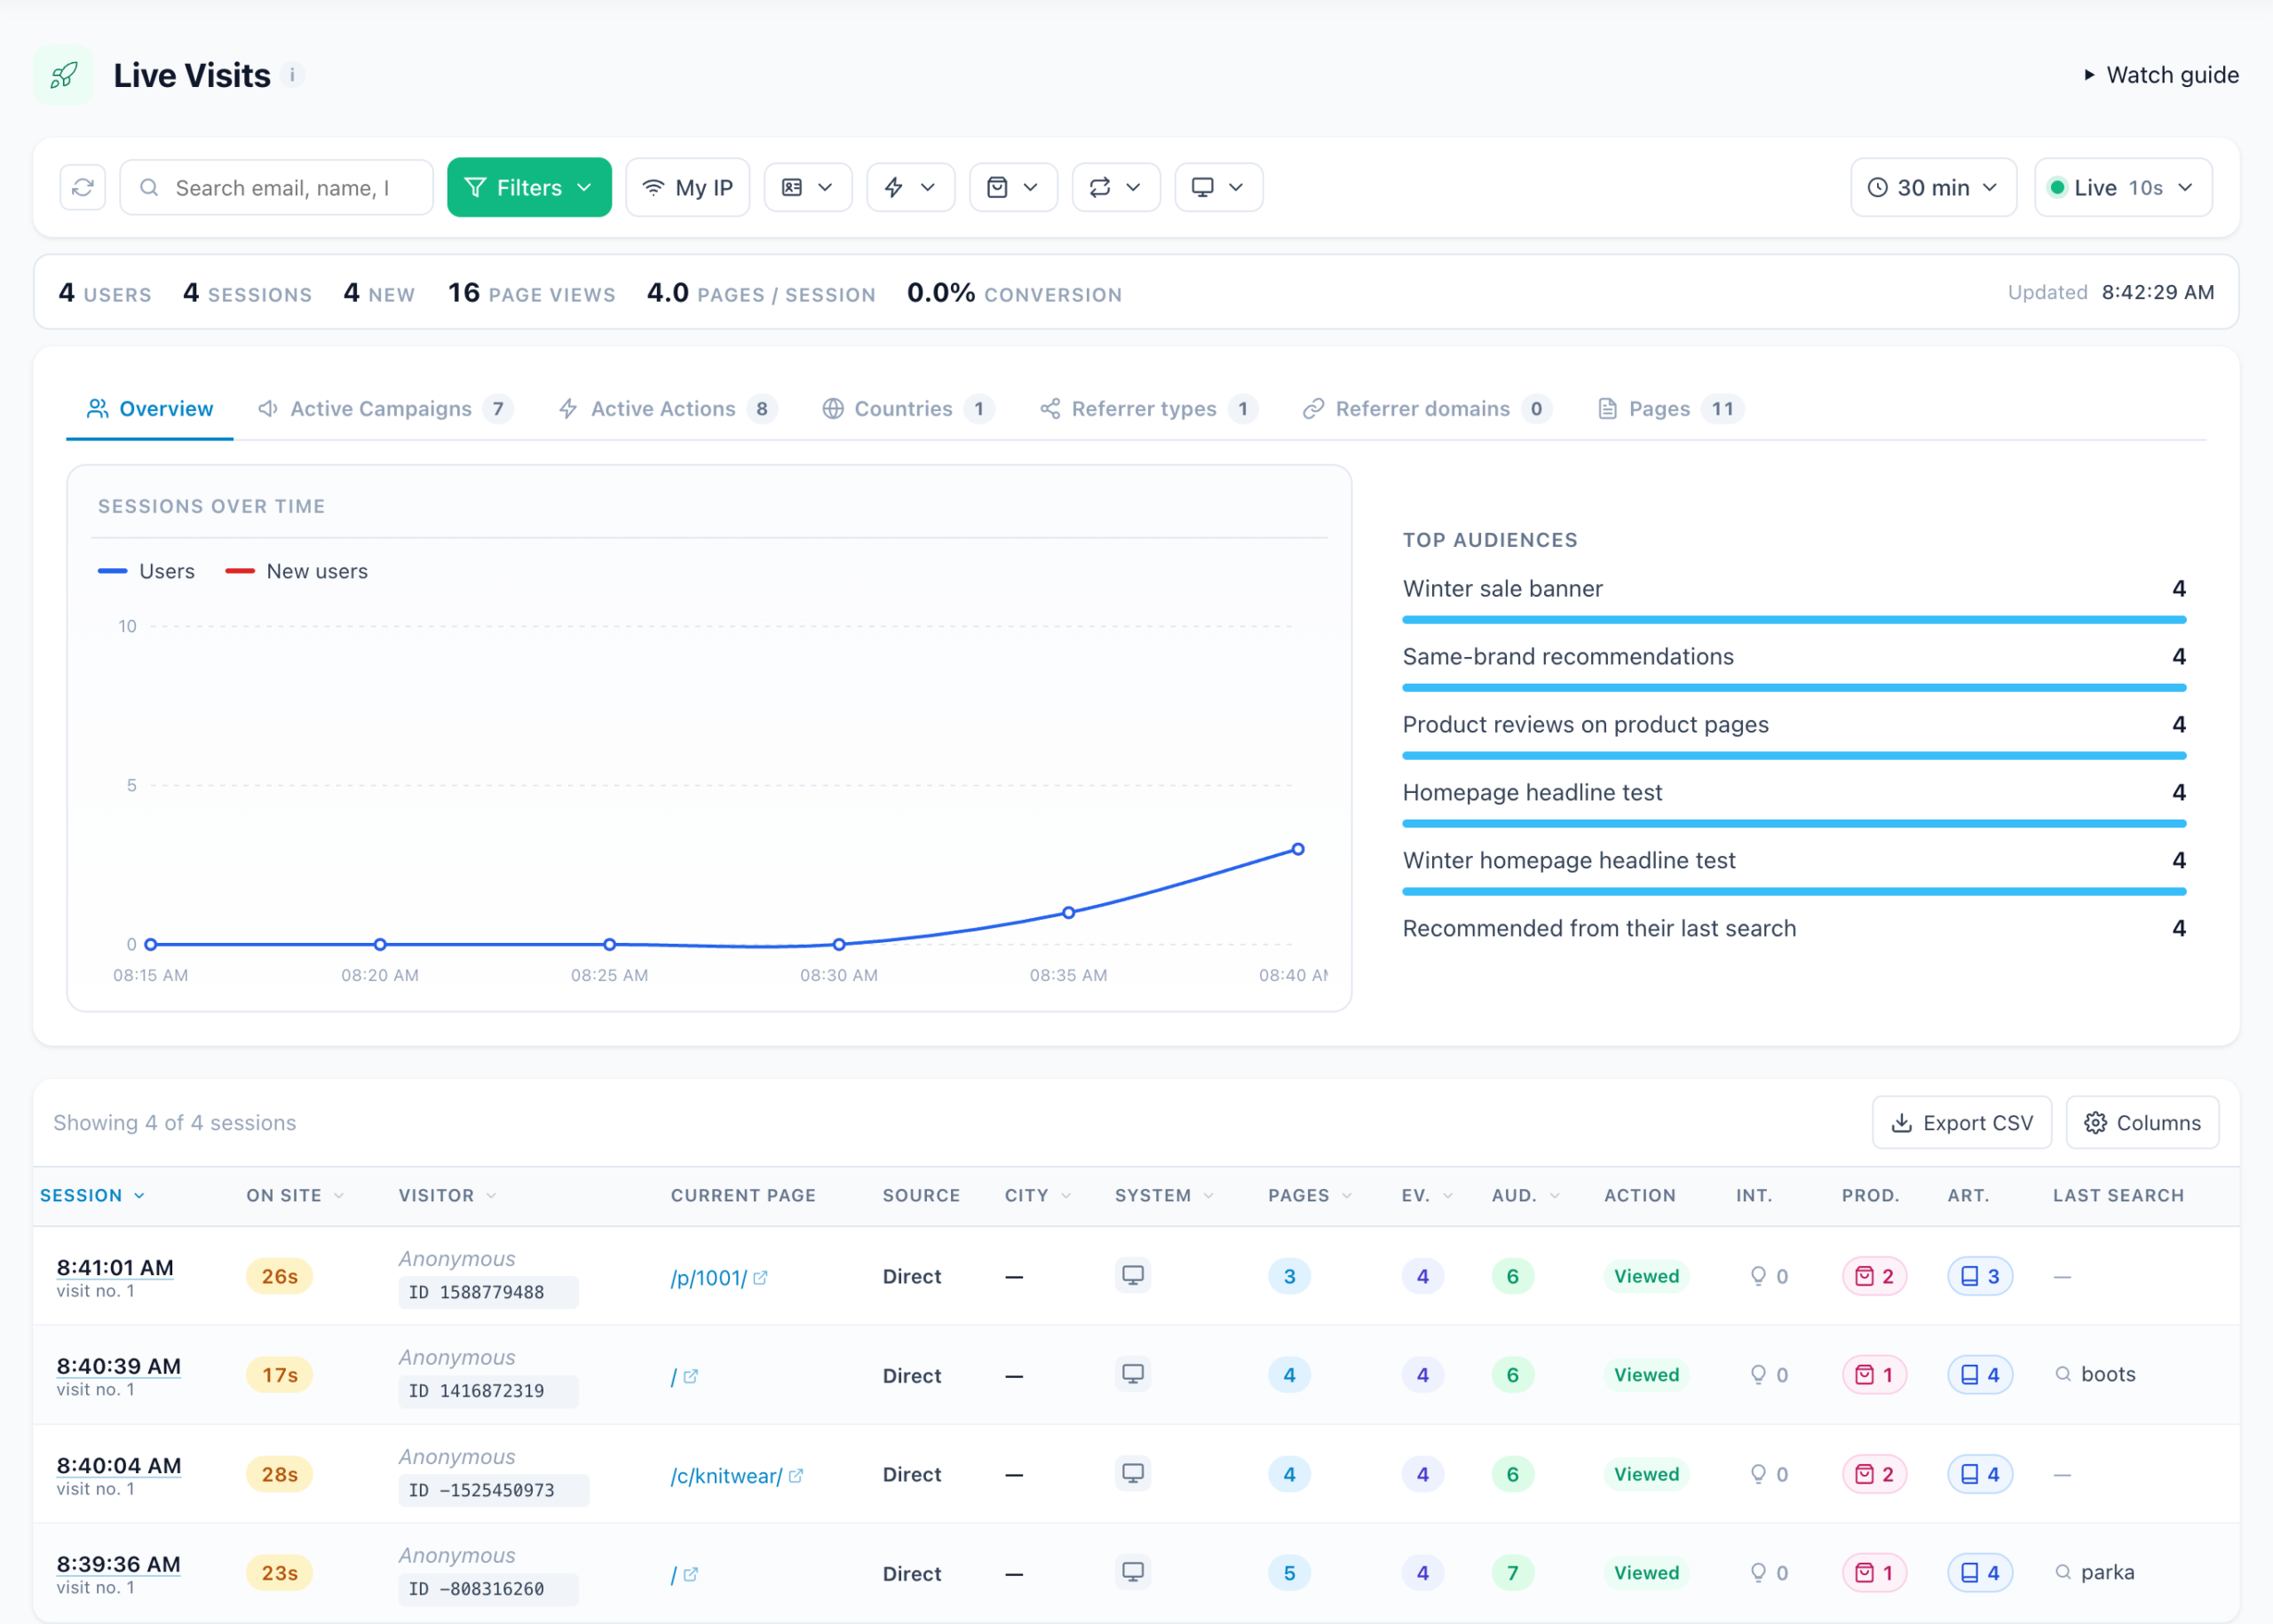
- Window and refresh: visits that started in the last 15 to 90 minutes, refreshed every few seconds. The bar shows users, visits, new visitors, page views, pages per visit and the conversion rate.
- Tabs: split the same visits by active campaigns, actions, countries, referrers and pages.
- Action column: shows the furthest each visit got. The levels, from furthest down, are Converted, Sent a form, Clicked, Viewed, Sent, and Nothing to show (the content had nothing to display).
- Use it to confirm a launch works, and to watch tracking events arrive. See Live Activity.
Campaign activity follows one campaign live. It splits the visitors on the site into those it matches and those it does not, and shows what the campaign did for each one. On this screen Shown means on screen, the same as Viewed elsewhere, and Executed means sent but not yet confirmed.
AI Chat
Where: Analytics → On-site campaigns → AI Chat, and the Conversations tab of a campaign that carries the assistant.
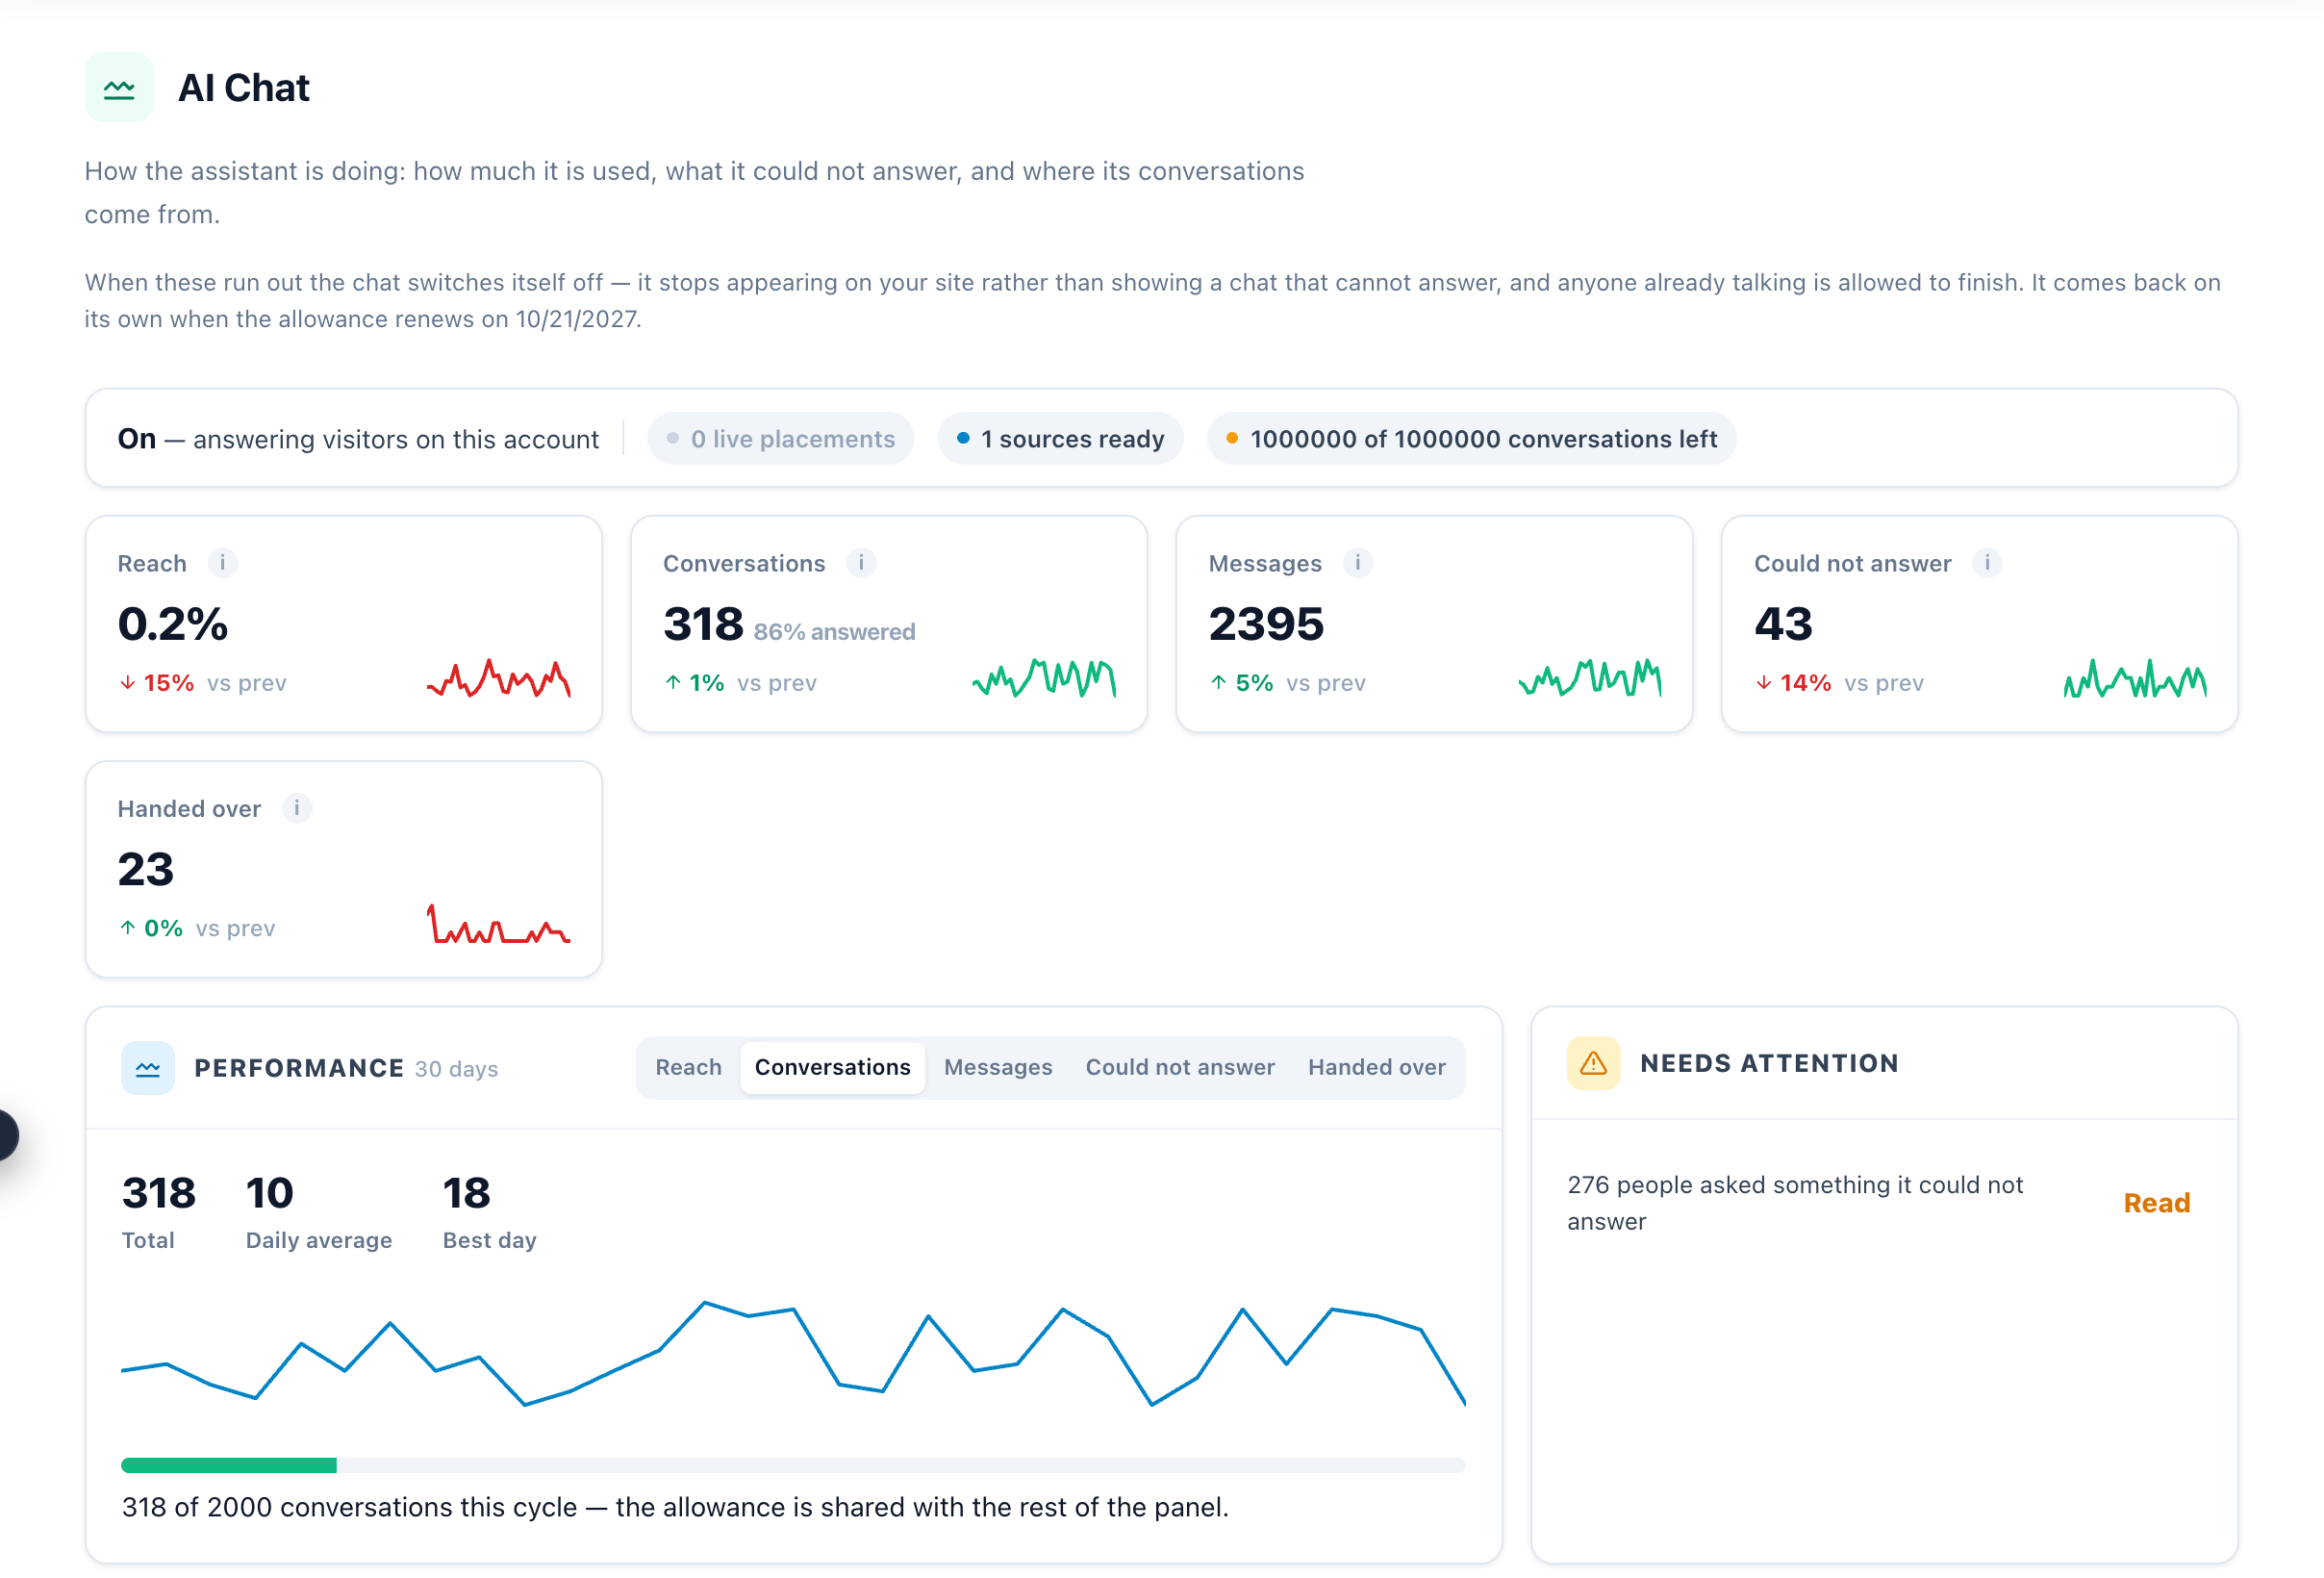
| Figure | What it counts | How to read it |
|---|---|---|
| Reach | Conversations ÷ all visits to the site. | The one figure that says whether anybody is finding the chat. |
| Conversations | Visitors who opened the chat and said something. | The share answered is beside it. |
| Messages | Every turn, from either side, including operator replies. | |
| Could not answer | Conversations whose last answer found nothing to say. | These are the questions worth writing a page about. A fall is shown in green. |
| Handed over | Conversations passed to a person. | Rising with steady volume usually means the assistant lost ground, not that traffic grew. |
This report always covers the last 30 days (including today) and ignores the Reporting range. Asked most, unanswered looks back 90 days. On a campaign’s Conversations tab, Reach is measured against the times the chat was shown by that campaign, not against site visits.
Landing pages
Where: Analytics → On-site campaigns → Landing pages.
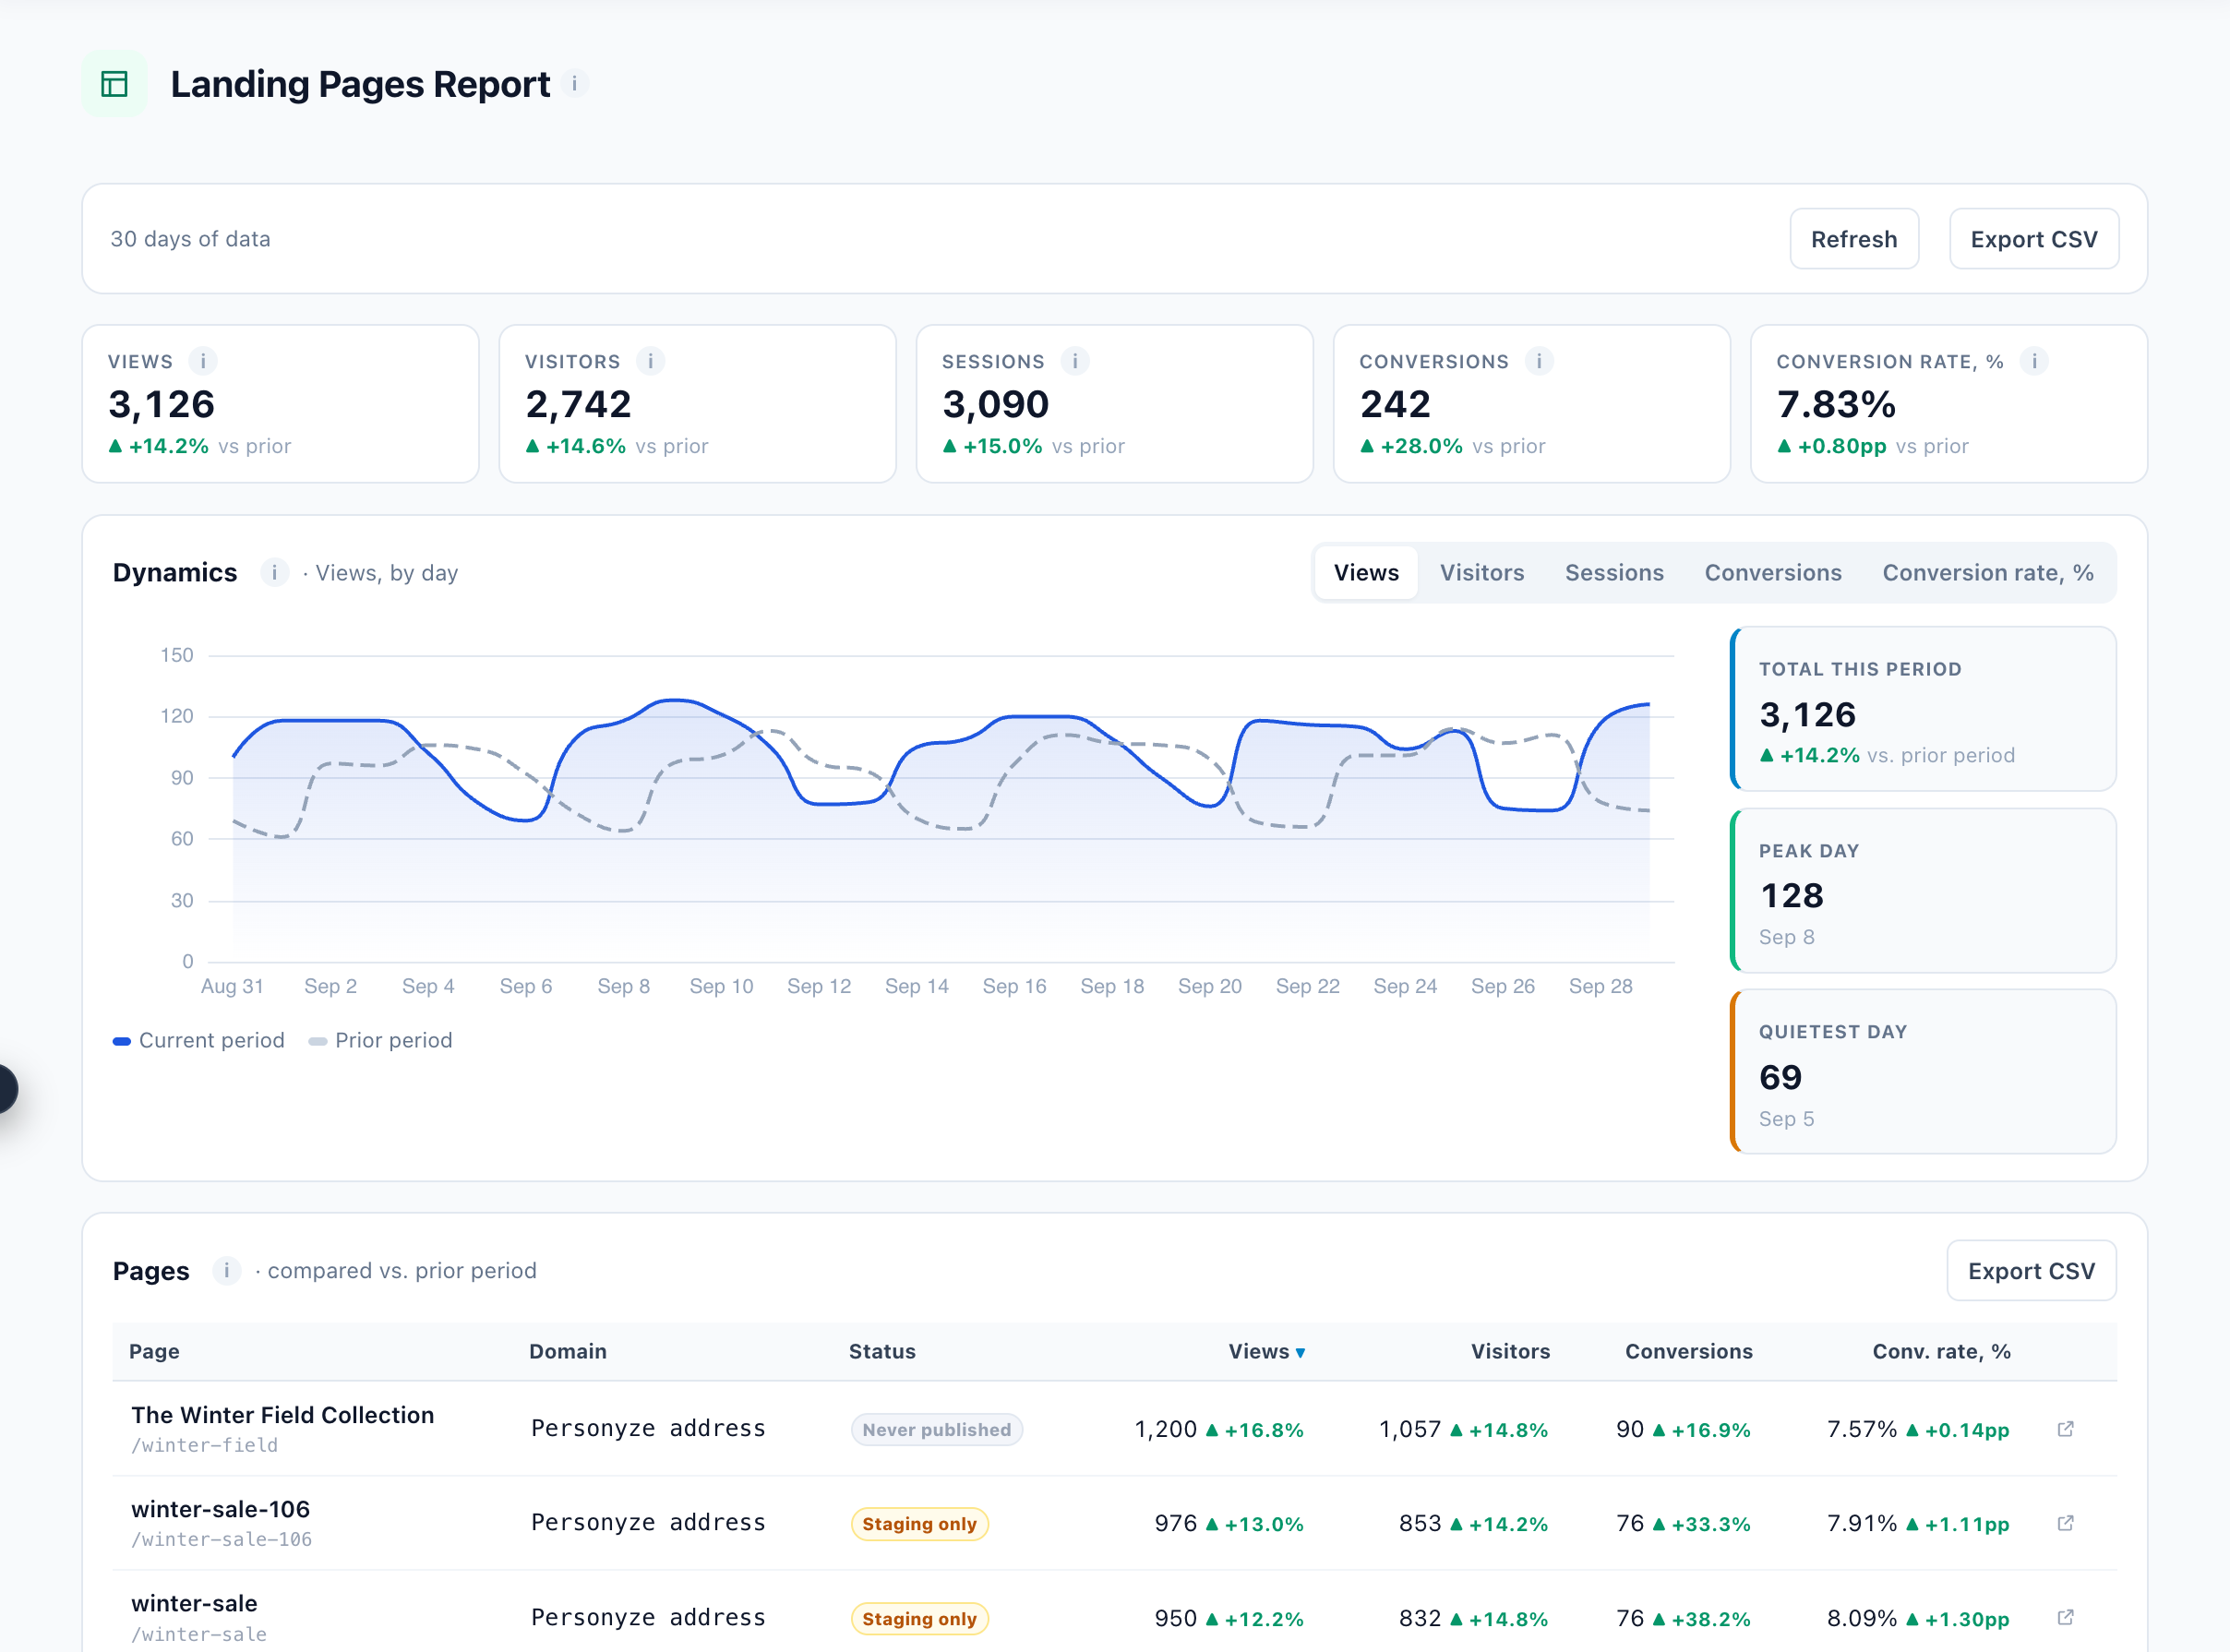
- Views are page views the tracker confirmed. They are normally lower than the hosted views you are billed for, which are counted when the page is served.
- Visitors are counted per day and added up.
- Conversion rate is converting visits ÷ visits with a landing-page view.
- A/B page tests shows each variant’s share of views and its conversion rate, but no significance test. Judge a page test on the A/B report.
- Traffic sources counts goal events, so its conversions will not match the tiles.
Forms
Where: Analytics → On-site campaigns → Forms, and a campaign’s Forms tab.
| Figure | What it counts |
|---|---|
| Total submissions | Every form submission in the range. |
| Unique submitters | People, each counted once however many forms they sent. |
| Submission rate | Visits that sent a form ÷ visits in which a form was shown. |
| Avg time to submit | Time from the start of the visit to the submission. Lower means visitors decide quickly. |
Below the figures: submissions over time (by day, week or hour of day, in GMT), the top forms, the top sources (UTM source or referrer), and every submission with its field values and a link to the visitor’s profile.
Email, SMS, web push and 3rd-party emails
Where: Analytics → Off-site campaigns. Figures are dated by the day a message was sent: a later open or click is credited back to that day.
| Email & SMS | What it counts |
|---|---|
| Sent | Messages handed to the sending service. Messages, not people. |
| Open rate | Messages whose tracking pixel loaded ÷ messages sent. Blocked images undercount opens. |
| Click rate | Link clicks ÷ messages sent. It counts clicks, so it can pass 100%. The sub-line gives CTOR: clicks ÷ opened messages. |
| Conversions | Goals completed by recipients after clicking, added up across your goals. |
| Unsubscribed | Recipients who unsubscribed, as a share of opened messages. |
There is no bounce figure. A campaign’s Recipient report counts people instead of messages, and its Error stage is the nearest thing to a bounce. Purchases are credited when they happen within 24 hours of a click.
| Web push | What it counts |
|---|---|
| Sent | Notifications handed to the browser’s push service. |
| Shown | Notifications the browser confirmed. This is a floor, not a delivery rate: confirmation only arrives when a notification is clicked or dismissed. |
| Click rate | Notifications clicked ÷ sent. One click per notification, so it cannot pass 100%. |
| Conversions | Goals reached after a notification, as a share of notifications sent. |
3rd-party emails (widgets you placed in emails sent by another tool) start at Viewed. Personyze does not send the email, so there is no Sent, bounce or unsubscribe. The funnel then runs Clicked → Added to cart → Purchased, with attributed revenue.
Reviews, Feedback and Surveys
Each campaign with a review widget, feedback question or survey has its own tab on the Performance step. It covers what was seen, answers, response rate, NPS, average stars and reviews collected. See Reviews, Feedback & Survey Reports.
Surveys add how far visitors got (shown, started, finished, where they stop), where each survey was answered — your site, its own page, a QR code or an email — and an AI summary of the written answers. See Survey Reports and the AI Summary.
Getting the numbers out
- Dashboards. Build your own view from any of the cards above, share it, show it on a wallboard or have it emailed. See Dashboards.
- Scheduled reports (Automation → Scheduled reports, or Schedule report on a campaign) email a campaign’s figures on a schedule, with a CSV of every section. The window ends at midnight of the last day already processed. For an email campaign, the emailed report gives Click rate as clicks ÷ opened messages; the panel’s Click rate is clicks ÷ sent.
- Export buttons on Campaign performance, Landing pages, Forms and the Recommendation Sets give you CSV files.
- Your own analytics. Send campaign events to GA4, the GTM data layer, Segment, Tealium, Amplitude, Mixpanel and more, so the numbers sit beside the rest of your reporting. See Send Event to Analytics and Site Profile Settings.
Reading a result honestly
- Compare rates, not counts, when campaigns differ in size. Ignore rates on tiny samples.
- Use Viewed, not Sent, as the base for how many people saw something.
- Never add session-based figures across campaigns. Conversions, visits and audience revenue count one visitor in every campaign they matched.
- Tell audience revenue from attributed revenue. Only attributed revenue is what a widget earned.
- Judge a test on its cumulative line and your threshold. A daily line swings on low-traffic days.
- Give it time. Numbers appear one to three hours after a visit ends, and a campaign needs enough traffic before a trend means anything.